LINEAR INEQUALITIES — MATHS STD 11 Science — Question
Gujarat BoardEnglish MediumSTD 11 ScienceMATHSLINEAR INEQUALITIES2 Marks
Question
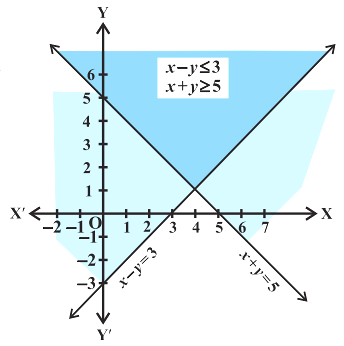
Solve the following system of linear inequalities graphically.
x + y ≥ 5
x - y $\le$ 3
✓
Answer
Given, x + y $\geq$ 5..... (1) x - y $\leq$ 3..... (2) The graph of linear equation x + y = 5 is drawn in the figure We note that the solution of inequality (1) is represented by the shaded region above the line x + y = 5, including the points on the line. On the same set of axes, we draw the graph of the equation x – y = 3 as shown in the figure. Then we note that inequality (2) represents the shaded region above the line x – y = 3, including the points on the line. Clearly, the double shaded region, common to the above two shaded regions is the required solution region of the given system of inequalities.
Need a full question paper?
Generate a complete, print-ready paper with questions like this in minutes — across 16+ boards, with answer keys.