Question
State and explain three properties of indifference curves.
The indifference curves slope downwards, left to right, because an increase in the amount of Good X along the indifference curve is associated with a decrease in the amount of Good Y, as the preferences are monotonic.
Marginal rate of substitution (MRS) is the rate at which a consumer is willing to substitute one commodity for another commodity.
Slope of indifference curve between A and B $=\frac{\Delta\text{Y}}{\Delta\text{X}}=\text{MRS}$
MRS is the rate at which the output of Good Y is sacrificed for every additional unit of Good X.
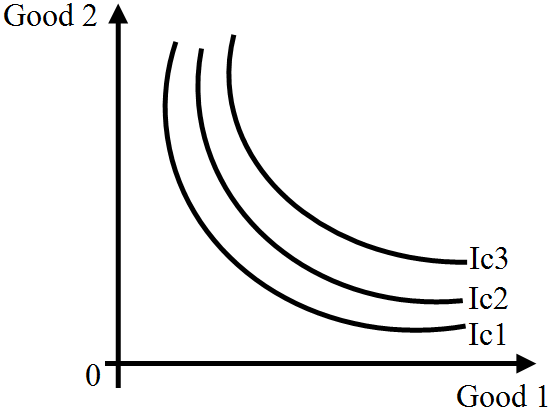
An indifference map refers to a set of indifference curves. An indifference curve which is to the right and above another shows a higher level of satisfaction to the consumer. Here, IC3 shows higher level of satisfaction than IC2. Thus, the indifference curve relates to a higher level of income of the consumer.
Generate a complete, print-ready paper with questions like this in minutes — across 16+ boards, with answer keys.
| Output (units) ₹ | 1 | 2 | 3 | 4 | 5 |
| Total Cost ₹ | 9 | 17 | 24 | 29 | 36 |
| Total Revenue | 11 | 20 | 27 | 32 | 35 |
| Q | TC |
| 1 2 3 4 5 6 | 50 65 75 95 130 185 |
| | | (₹ crores) |
| (i) | Net current transfers to abroad | 10 |
| (ii) | Private final consumption expenditure | 500 |
| (iii) | Current tansfers from government | 30 |
| (iv) | Net factor income to abroad | 20 |
| (v) | Net exports | (-) 20 |
| (vi) | Net indirect tax | 120 |
| (vii) | National debt interest | 70 |
| (viii) | Net domestic capital formation | 80 |
| (ix) | Income accruing to government | 60 |
| (x) | Government final consumption expenditure | 100 |
| Price per unit (₹) | Total expenditure (₹) |
| 10 | 180 |
| 9 | 162 |