Question
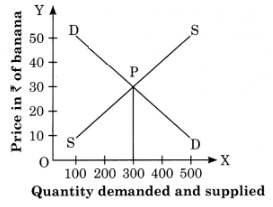
State the relationship between price and quantity supplied.

Answer

This diagram shows the direct relationship / between price and quantity supplied of) chocolates. When its price is ? 10, 200 units ( are supplied and as price rises to 15, 20, 25 ? …. and so on, quantity supplied also rises to )
When the schedule is plotted on the graph we 250, 300, 350 and so on. This is the law of supply of an individual firm.

Need a full question paper?

Generate a complete, print-ready paper with questions like this in minutes — across 16+ boards, with answer keys.

Start Generating Free

Similar questions

Direction of Indias imports

Image

Share of top Five Commodities in India’s Export 2018-19
Image
QU 1. Name the second largest exported commodity in the year 2018-19.
QU 2. How much is the share of drug formulations, biologicals (chemical products) in total export of India.
QU 3. Which commodity has least share in the total export of India and how much was it?
QU 4. Give your opinion on India’s export.

Study the following table and answer the question.

Table A : Trade data for period 2009 – 10 to 2017 – 18
Image
QU 1. In which year export growth was least and how much?
QU 2. In which year import growth was maximum and how much?
QU 3. During which year trade balance was minimum?
QU 4. Which concept of Balance of Trade is applicable here?
QU 5. How much was India’s export value in the year 2017-18?
QU 6. Give your opinion on India’s foreign trade.
Rightward shift in demand curve …………….
Which orgamsation has maximum share in India’s direction of imports in 1990-91?
Identify and define the degrees of elasticity of demand from the following demand curves.

Image

A) Supply schedule of chocolates
Price in Rs.Quantity supplied in units
10200
15………
20300
25350
30……..
35……..
40……..
1) Demand at point ‘C’ is relatively elastic demand.
2) Demand at point ‘B’ is unitaiy elastic demand.
3) Demand at point ‘D’ is perfectly inelastic demand.
4) Demand at point ‘A’ is perfectly elastic demand.
Expand the abbreviations of OECD and OPEC
Derive the equilibrium price from the above schedule with the help of a suitable diagram.

Image