Question
Study the bar graph given below and answer the questions that follow.
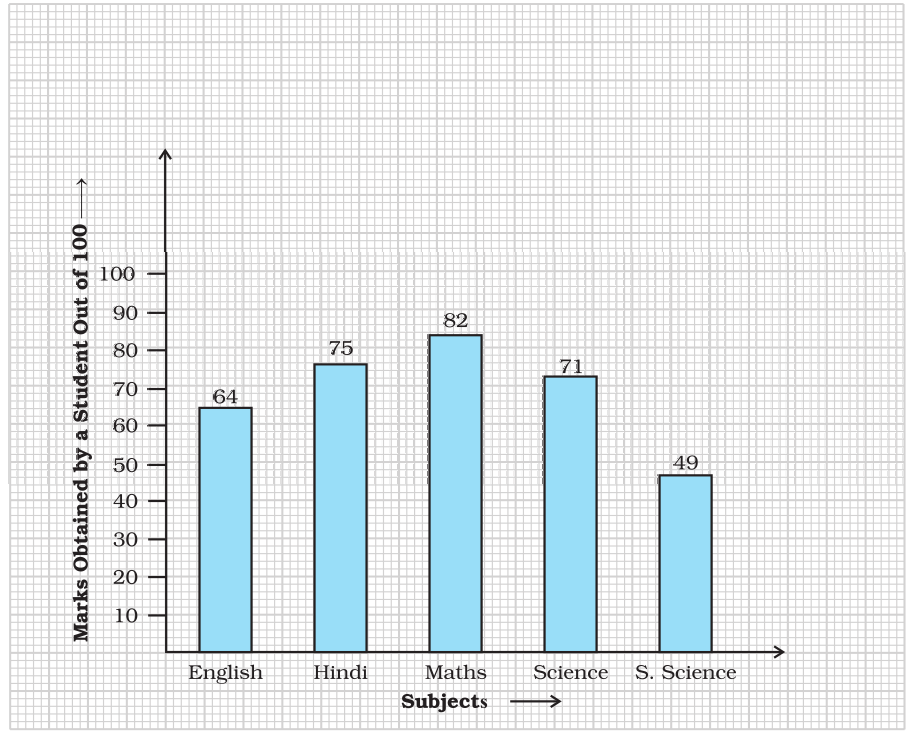
$a.$ What information is depicted from the bar graph?
$b.$ In which subject is the student very good?
$c.$ Calculate the average marks of the student.
$d.$ If $75$ and above marks denote a distinction, then name the subjects in which the student got distinction.
$e.$ Calculate the percentage of marks the student got out of $500.$