Question
Study the double bar graph given below and answer the questions that follow
:
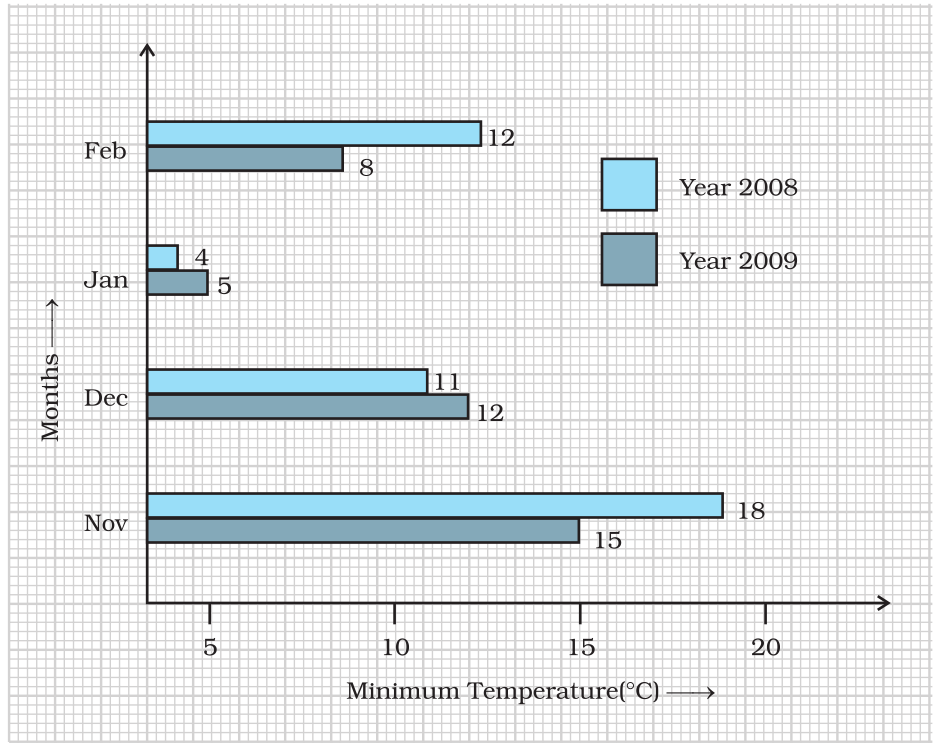
$a.$ What information is compared in the above given double bar graph?
$b.$ Calculate the ratio of minimum temperatures in the year $2008$ to the year $2009$ for the month of November.
$c.$ For how many months was the minimum temperature in the year $2008$ greater than that of year $2009$? Name those months.
$d.$ Find the average minimum temperature for the year $2008$ for the four months.
$e.$ In which month is the variation in the two temperatures maximum?

Answer

$a.$ The above double bar graph compares the minimum temperature during the month November to February for the years $2008$ and $2009$.
$b.$ Minimum temperature of November in year $2008 = 18^\circ C$
Minimum temperature of November in year $2009 = 15^\circ C$
$\therefore$ Required ratio $=\frac{18}{15}=18:15=6:5$
$c.$ We can clearly see from the double bar graph that the minimum temperature in the year $2008$ greater than that of the year $2009$ for the month of February and November.
$d.$ Average minimum temperature for year $2008$
$=\frac{\text{Total temperature for year $2008$ in four months}}{4}$
$=\frac{18+11+4+12}{4}$
$=\frac{45}{4}$
$=11.25$
$e.$ Difference of temperature for different months can be shown by following table:
Month
Difference of tempreature
November
$18 - 15 = 3$
December
$12 - 11 = 1$
January
$5 - 4 = 1$
February
$12 - 8 = 4$
From the above table, it is clear that for the month of February variation in two temperatures is maximum.

Need a full question paper?

Generate a complete, print-ready paper with questions like this in minutes — across 16+ boards, with answer keys.

Start Generating Free

Similar questions

In Fig, $P$ is the point on the side $BC$. Complete each of the following statements using symbol $'=\ ’,\ ’ >\ '$ or $‘<\  ‘$ so as to make it true:
$i. AP… AB+ BP$
$ii. AP… AC + PC$
$iii. \text{AP}...\frac{1}{2}(\text{AB}+\text{AC}+\text{BC})$
Look at the bar graph given below.

Read it care fully and answer the following questions.
$i.$ What information does the bar graph give?
$ii.$ In which subject is the student very good?
$iii.$ In which subject is the poor?
$iv.$ What is the average of his marks?
A well of diameter $140\ cm$ has a stone parapet around it. If the lenght of the outer edge of the parapet is $616\ cm,$ find the width of the parapet.
The mean of the following data is $20.6.$ Find the value of $p.$
x:
$10$
$15$
$p$
$25$
$35$
f:
$3$
$10$
$25$
$7$
$5$
The following table shows the interest paid by a company (in lakhs):

Year 1995-96 1996-97 1997-98 1998-99 1999-2000
Interest (in lakhs of rupees) 20 25 15 18 30

Draw the bar graph to represent the above information.

In Fig. line $l \| m$ and a transversal $n$ cuts them at $P$ and $Q$ respectively. If $\angle 1=75^{\circ}$, find al other angles.
Image
From a circular card sheet of radius 14 cm , two circles of radius 3.5 cm and a rectangle of length 3 cm and breadth 1 cm are removed. (as shown in the adjoining figure). Find the area of the remaining sheet. $\left(\right.$ take $\left.\pi=\frac{22}{7}\right)$
Image
In Fig., $A B C D$ is a parallelogram, $D L \perp A B$ and $D M \perp B C$. If $A B=18 cm, B C=12 cm$ and $D M=9.3 cm$, find $D L$.
Image
If $\frac{9^n \times 3^2 \times 3^n-(27)^n}{\left(3^3\right)^5 \times 2^3}=\frac{1}{27}$, find the value of $n$.
Two sides of a parallelogram are 20 cm and 25 cm. If the altitude corresponding to the sides of length 25 cm is 10 cm, find the altitude corresponding to the other pair of sides.