Question
Study the double bar graphs given below and answer the following questions:
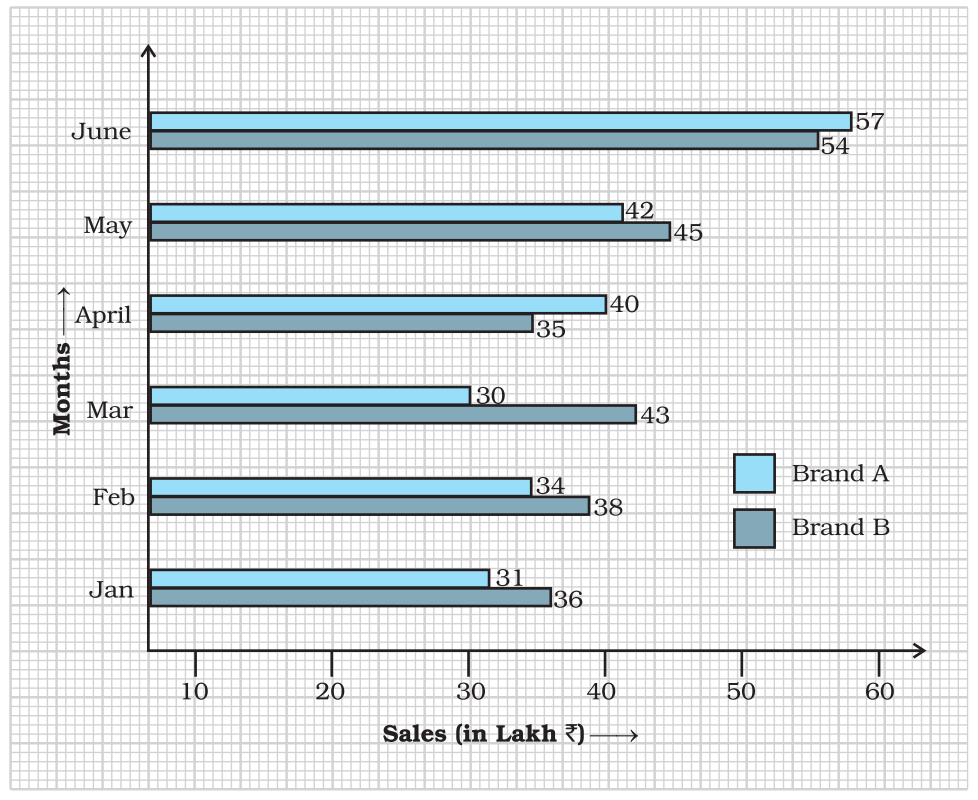
$a.$ What information is represented by the above double bar graph?
$b.$ In which month sales of brand $A$ decreased as compared to the previous month?
$c.$ What is the difference in sales of both the brands for the month of June?
$d.$ Find the average sales of brand $B$ for the six months.
$e.$ List all months for which the sales of brand $B$ was less than that of brand.
$f.$ Find the ratio of sales of brand $A$ as compared to brand $B$ for the month of January.