Question
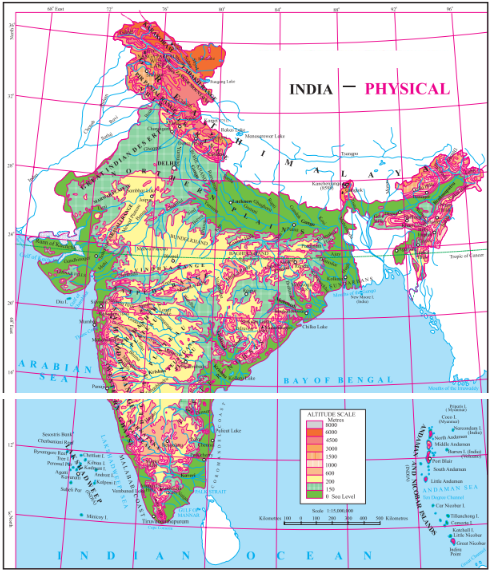
Study the map given in figure and answer the following questions:

Image

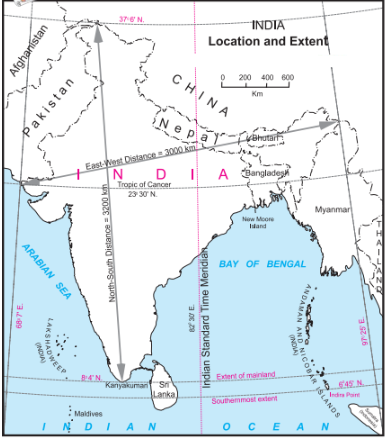
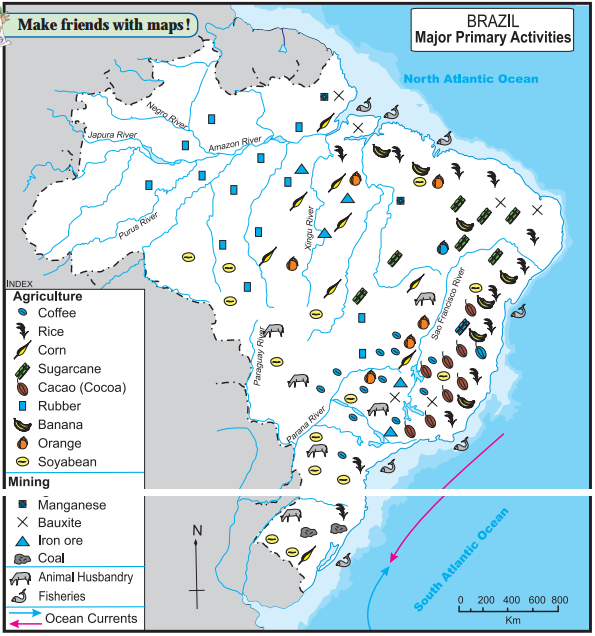
(1) Calculate the difference between the two longitudinal extremes of mainland India. Is it more than Brazil?
(2) Which longitude in India is called the Indian Standard Time (IST)?
(3) What is the difference between IST and the GMT?
(4) How many local times are there in India?
(5) How much is the time difference between the western most and the eastern most points of India?

Answer

A-1 The difference between the two longitudinal extremes of east and west mainland India is about 29°.
A-2 The 82° 30′ E longitude is called Indian Standard Time (IST)
A-3 The IST time is 5 hours and 30 minutes ahead of the GMT.
A-4 There are 29 local times.
A-5 Two hours, 120 minutes.

Need a full question paper?

Generate a complete, print-ready paper with questions like this in minutes — across 16+ boards, with answer keys.

Start Generating Free

Similar questions

Image
(1) What was the percentage of urbanisation in 1961?
(2) In which decade was urbanisation the highest?
(3) In which decade was the growth of urbanisation lowest?
(4) What was the growth in the percentage of urbanisation between 1961 and 1971?
(5) What was the growth in the percentage of urbanisation between 1991 and 2011?
(6) What inference can you draw regarding India’s urbanisation after reading the graph?

Study the graphs and answer the following questions on

Image
(1) In which years did the value of exports to Brazil exceed the imports from Brazil?
(2) In which year was trade with Brazil the most favourable of all?
(3) Comment upon the Balance of Trade in the year 2013.
(4) From which year the value of exports to Brazil have exeeded the value of import from Brazil?
(5) Write a note on the trade between Brazil and India.
(6) In which year was the value of exports to Brazil the maximum?

Prepare a choropleth map showing urban population using the data given in the table below.

S.No.Urban population percentage categoryStates /UTs falling in the category
(1)0-20Himachal Pradesh, Bihar, Assam and Odisha
(2)21-40Meghalaya, Uttar Pradesh, Arunachal Pradesh, Chhattisgarh, Jharkhand, Rajasthan, Sikkim, Tripura, Jammu and Kashmir, Nagaland, Manipur, Uttarakhand, West Bengal, Andhra Pradesh, Haryana, A and N Islands, Punjab, Karnataka and M. P.
(3)41-60Gujarat, Maharashtra, Dadra and Nagar Haveli, Kerala, Tamil Nadu, Mizoram
(4)61-80Goa, Puducherry, Daman and Diu, Lakshadweep
(5)81 -100Chandigarh, NCT of Delhi


Image
(1) Compare and classify the population densities shown in the figure ‘a’ and ‘b’ representing 1 sq. km. of area.
(2) If in figure B one sign = 100, then what will be the sex ratio?
Show the following on a given outline map of Brazil.
Given index:(A) Ports:
  • Vitoria
  • Manaus
(B) Airports:
  • Brasilia
  • Campo Grande
(C) Railway Junctions:
  • Sao Paulo
  • Rio de Janeiro

Image
(1) In which direction does the region with an altitude of more than 6000m lie in India ?
(2) Look for the south-flowing river in the peninsular region. In which river basin does it lie?
(3) In which direction is the slope of the region in the north shown in dark green?
(4) Make a list of plateaus located in between Aravalli ranges and Chhota Nagpur Plateau?
Study the transport map of Brazil and answer the following.

Image
(1) Which means of transport are seen on the map?
(2) Which means of transport has a denser network?
(3) Which highway can be seen prominently? Which places does it join?
(4) What could be the reason for the development of railways in the South-East?
(5) In which part of Brazil do you see a lesser development of transport network? What could be the reason?

Observe the given map carefully and answer the following questions:
Image
(1) What does the map indicate ?
(2) Which part of India has many airports compared to the others?
(3) Which part of India has a dense network of rail routes?
(4) Name the northernmost important railway station.
(5) Name the easternmost important railway station.
(6) Name the two westernmost important railway stations.

Look at the map given in Fig. The major primary occupations in Brazil are shown here. Discuss the following points and write your observations.Image
(1) In which part of Brazil is coffee mainly produced?
(2) Which food crops are mainly produced in Brazil?
(3) Can you relate the production of these crops with the climate there?
(4) Where are the rubber plantations concentrated?
(5) Complete the table.
Types of crops Crops Areas of Prodution
Food crops    
   
Cash crops    


Fruits and Vegetables    
   
In the figure (a) and (b), you can see images of two settlements in Brazil. One is from the Amazon river basin in Brazil while the other belongs to the coastal area. Observe the settlement patterns carefully and name the types of settlement patterns. Write a comment on their density and types.
Image