Question
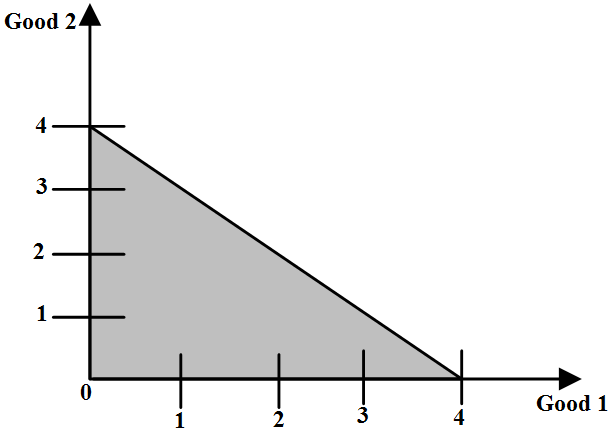
Suppose a consumer wants to consume two goods which are available only in integer units. The two goods are equally priced at Rs $10$ and the consumer's income is Rs $40$.
  1. Write down all the bundles that are available to the consumer.
    1. Among the bundles that are available to the consumer, identify those which cost her exactly Rs $40$.

Answer

  1. $P_1$ = Rs $10$
$P_2$ = Rs $10$
$M$ = Rs $40$
$\text{Budget set}=\text{P}_1\text{x}_1+\text{P}_2\text{x}_2\leq40\text{M}$
$10\text{x}_1+10\text{x}_2\leq40$
The bundles that are available to the consumer should cost less than or equal to Rs 40.

$\text{Horizontal intercept }=\frac{\text{M}_2}{\text{P}_1}=\frac{40}{10}=4$
$\text{Vertical intercept}=\frac{\text{M}^2}{\text{P}_2}=\frac{40}{10}=4$
$\text{Slope}=\frac{-\text{P}_1}{\text{P}_2}=\frac{-10}{10}=-1$
  1. The bundles in the shaded region $(\triangle\text{AOB})$ are all available to the consumer, including the bundles lying on the line AB.
(0, 0) (0, 1) (0, 2) (0, 3) (0, 4)
(1, 0) (1, 1) (1, 2) (1, 3) (2, 0)
(2, 1) (2, 2) (3, 0) (3, 1) (4, 0)
The coordinates that lie on the line AB cost exactly the same as the income of the consumer. The bundles are as follows:
(0,4) (1,3) (2,2) (3,1) (4,0)

Need a full question paper?

Generate a complete, print-ready paper with questions like this in minutes — across 16+ boards, with answer keys.

Start Generating Free

Similar questions

Explain the implication of the following: The feature of ‘no close substitutes' under monopoly.
The price elasticity of demand of a commodity $X$ and $Y$ are equal. The price of $X$ falls from $10$ to $8$ per unit and its quantity demanded rises by $20$ percent. The price of Y rises by $10$ percent. Calculate the percentage decrease in its demand.
What is meant by prices being rigid? How can oligopoly behaviour lead to such an outcome?
Comment upon the shape of demand curve if the price of a commodity rises by 10% and there is no change in its quantity demanded.
Demand curve facing a monopoly firm is a constraint for the monopolist." Comment.
From the following data on cost schedule of a firm, calculate.
  1. Average fixed cost and.
  2. Average variable cost of producing 3 units of output:
Units of Output (No.)
0
3
Total Cost ( Thousand)
51
96
Explain the meaning of opportunity cost with the help of Production Possibility Schedule.
Total fixed cost is ₹ 90, complete the following table:
Output (Units)
MC
TC
ATC
1
10
-
-
2
20
-
-
3
15
-
-
  1. What is a budget line? What does the point on it indicate in terms of prices?
  2. A consumer consumes only two 2 pieces of goods X and Y. Her money income is 24 and the prices of pieces of goods X and Y are 24 and 2 respectively.
Answer the following questions:
  1. Can the consumer afford a bundle 4X and 5Y? Explain.
  2. What will be the MRS. when the consumer is in equilibrium? Explain.
Why a firm's demand curve indeterminates under oligopoly?