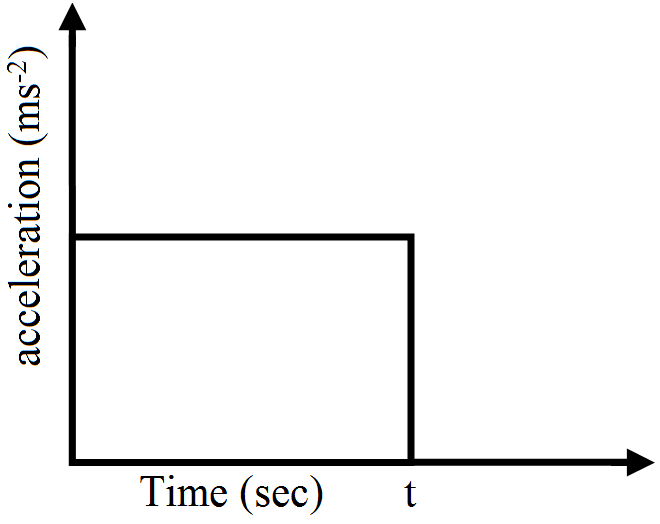
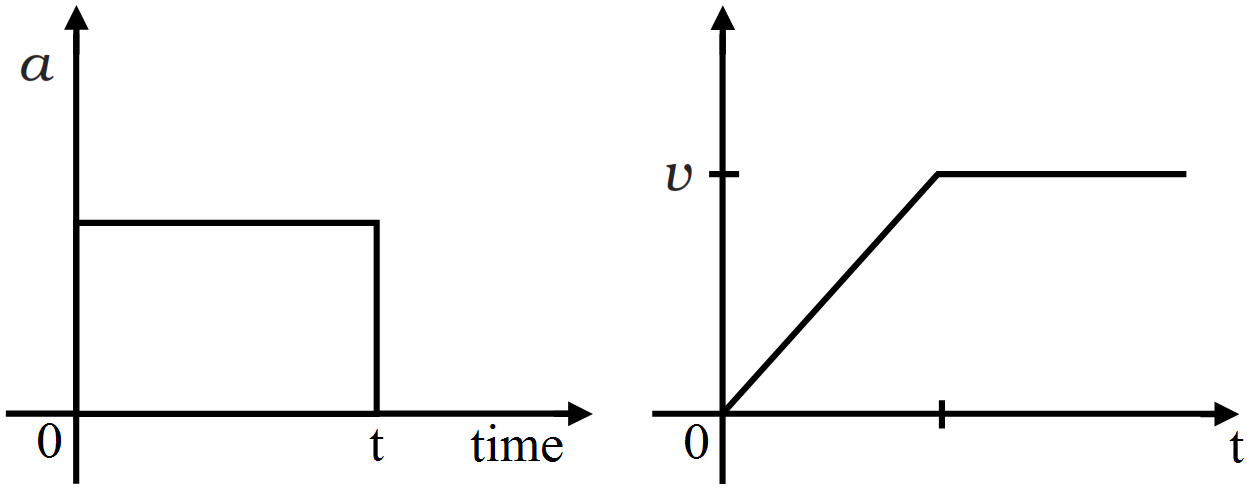
Question
The acceleration-time graph for a body is shown in the figure below. Plot the corresponding velocity-time graph.

Answer

For time t, there is an acceleration a. $\therefore$ Velocity increases after time 't' acceleration is zero. Thus v-t graph will be shown as

Need a full question paper?

Generate a complete, print-ready paper with questions like this in minutes — across 16+ boards, with answer keys.

Start Generating Free