- If we measure the frequencies of light emitted due to transitions between excited states and the first excited state.
- As a sequence of frequencies with the higher frequencies getting closely packed.
Solution:
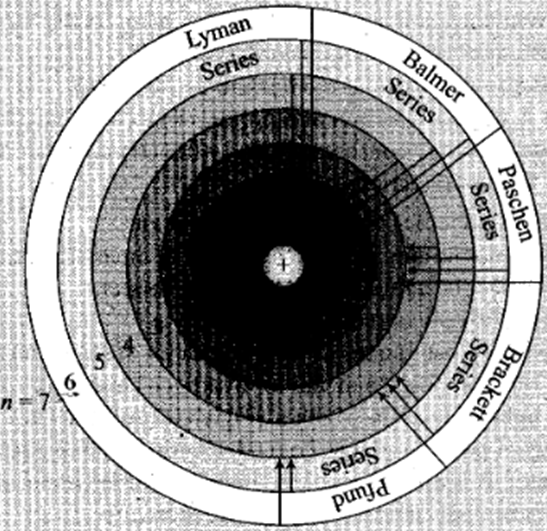
Key concept: The vatious lines in the atomic spectra are produced when electrons jump fron higher energy state to a lower energy state and photons are emitted. These spectral lines are called emission lines.
- Mainly there are five series and each series is named after its discoverer as Lyman series, Balmer series, Paschan series, Bracket series and Pfund series.
- According to the Bohr's theory the wavelength of the radiations emitted from hydrogen atom is given by
$\frac{1}{\lambda}=\text{R}\bigg[\frac{1}{\text{n}_1^2}-\frac{1}{\text{n}_2^2}\bigg]$
$\Rightarrow\ \lambda=\frac{\text{n}_1^2\text{n}_2^2}{(\text{n}_2^2-\text{n}_1^2)\text{R}}=\frac{\text{n}_1^2}{\Big(1-\frac{\text{n}_1^2}{\text{n}_2^2}\Big)\text{R}}$
where n2 = outer orbit (electron jumps from this orbit), n1 = inner orbit (electron falls in this orbit)
- First line of the series is called first member, for this lines wavelength is maximum $(\lambda_\text{max})$.
- For maximum wavelength if n1 = n, then n2 = n + 1.
- So $\lambda_\text{max}=\frac{\text{n}^2(\text{n}+1)^2}{(2\text{n}+1)\text{R}}$.
- Last line of the series is called series limit, for this line wavelength is minimum $(\lambda_\text{max})$.
- Foe minimum wavelength $\text{n}_2=\infty,\text{n}_1=\text{n}.\text{ So}\lambda_\text{min}=\frac{\text{n}^2}{\text{R}}.$
- The radio of first member and series limit can be calculated as $\frac{\lambda_\text{max}}{\lambda_\text{min}}=\frac{(\text{n}+1)^2}{(2\text{n}+1)}$.
Different spectral series
| | Spectral Series | Transition | $\lambda_\text{max}$ | $\lambda_\text{min}$ | $\frac{\lambda_\text{max}}{\lambda_\text{min}}$ | Region |
| 1. | Lyman series | $\text{n}_2=2,3,4 \ ....\infty$ $\text{n}_1=1$ | $\frac{4}{3\text{R}}$ | $\frac{1}{\text{R}}$ | $\frac{4}{3}$ | Ultraviolet region |
| 2. | Blamer series | $\text{n}_2=3,4,5 \ ....\infty$ $\text{n}_1=2$ | $\frac{36}{5\text{R}}$ | $\frac{4}{\text{R}}$ | $\frac{9}{5}$ | Visible region |
| 3. | Paschen series | $\text{n}_2=4,5,6 \ ....\infty$ $\text{n}_1=3$ | $\frac{144}{7\text{R}}$ | $\frac{9}{\text{R}}$ | $\frac{16}{7}$ | Infrared region |
| 4. | Bracket series | $\text{n}_2=5,6,7 \ ....\infty$ $\text{n}_1=4$ | $\frac{400}{9\text{R}}$ | $\frac{16}{\text{R}}$ | $\frac{25}{9}$ | Infrared region |
| 5 | Pfund series | $\text{n}_2=6,7,8 \ ....\infty$ $\text{n}_1=5$ | $\frac{900}{11\text{R}}$ | $\frac{25}{\text{R}}$ | $\frac{36}{11}$ | Infrared region |
From above discussion we can say Balmer series for the H-atom can be observed if we measure the frequencies of light emitted due to transitions between higher excited states and the first excited state and as a sequence of frequencies with the higher frequencies getting closely packed.