Question
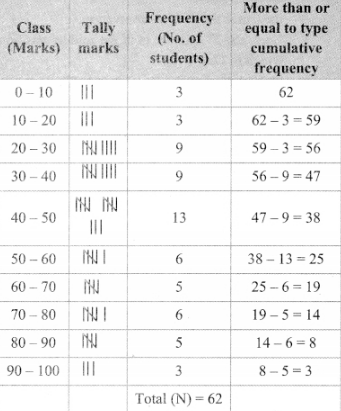
The data is given for 62 students in a certain class regarding their mathematics marks out of 100. Take the classes 0 – 10, 10 – 20,… and prepare frequency distribution
table and cumulative frequency table more than or equal to type.
55. 60, 81, 90, 45, 65, 45, 52, 30, 85, 20, 10,
75, 95, 09, 20, 25, 39, 45, 50, 78, 70, 46, 64,
42. 58. 31, 82, 27, 11, 78, 97, 07, 22, 27, 36,
35, 40, 75, 80, 47, 69, 48, 59, 32, 83, 23, 17,
77, 45, 05, 23, 37, 38, 35, 25, 46, 57, 68, 45.
47,49
From the prcparcd table, answer the following questions :
i. How many students obtained marks 40 or above 40?
ii. How many students obtained marks 90 or above 90?
iii. How many students obtained marks 60 or above 60?
iv. What is the cumulative frequency of equal to or more than type of the class 0 – 10?