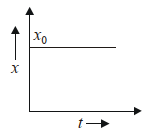
Question
The displacement time diagram of a body is shown in the figure. What does the curve show for $t<0$ and $t>0$ ?
Image

Answer

It is clear from the diagram that at $t <0$ the body is at rest but at some other point $x_0$ which is different from 0 for $t>0$.

Need a full question paper?

Generate a complete, print-ready paper with questions like this in minutes — across 16+ boards, with answer keys.

Start Generating Free