MCQ
The figure represents variation of triode parameter ($\pi$ or $r_p$ or gm) with the plate current. The correct variation of $\mu$and rp are given, respectively by the curves
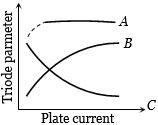
  • A
    $A$  and $B$
  • B
    $B $ and $C$
  • $A $ and $C$
  • D
    None of the above

Answer

Correct option: C.
$A $ and $C$
c
(c)$r_p$ varies with $i_p$ according to relation ${r_p} \propto i_p^{ - 1/3}$ i.e. when $i_p$ increases, $r_p$ decreases, hence graph $C $ represents the variation of $r_p$.
$\mu$ doesn't depends upon $i_p$, hence graph $A$  is correct.

Need a full question paper?

Generate a complete, print-ready paper with questions like this in minutes — across 16+ boards, with answer keys.

Start Generating Free

Similar questions