Gujarat BoardEnglish MediumSTD 11 SciencePhysics11. thermodynamics1 Mark
MCQ
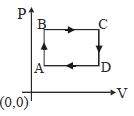
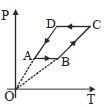
The figure shows $P-V$ diagram of a thermodynamic cycle. Which corresponding curve is correct?
✓
B
C
D
✓
Answer
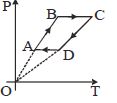
Correct option: A.
a $\begin{array}{lll}\text { For } A-B: V=\text { constant } & \text { (ideal qas equation } \Rightarrow) \\ (P \propto T) & (\text { straight line) } & (P V=n R T \\ A B & & (P \alpha T) \text { for } A B\end{array}$
For $B-C \because P=$ constant $(v \propto T)$ for $B C$
$(V \propto T)$ (constant line parallel to $T($ temperature)) axis.
For $C D$ it will be similar to $A B$
and $DA$ It will be simicar to $BC$
$\therefore$ considering all above constraints option $(A)$ is the correct graph
Need a full question paper?
Generate a complete, print-ready paper with questions like this in minutes — across 16+ boards, with answer keys.