MCQ
The fine structure of hydrogen spectrum can be explained by:
- Athe presence of neutrons in the nucleus.
- Bthe finite size of nucleus.
- Cthe orbital angular momentum of electrons.
- Dthe spin angular momentum of electrons.
Explanation:
The fine structure describes the splitting of the spectral lines of atoms due to electron spin angular momentum.
Generate a complete, print-ready paper with questions like this in minutes — across 16+ boards, with answer keys.
A straight wire carrying a current ![]() runs along the axis of a circular current
runs along the axis of a circular current ![]() . Then the force of interaction between the two current carrying conductors is
. Then the force of interaction between the two current carrying conductors is
|
(a) ∞ |
(b) Zero |
(c) |
(d) |
Television signals broadcast from the moon can be received on the earth while the TV broadcast from Delhi cannot be received at places about 100 km distant from Delhi. This is because
|
(a) There is no atmosphere around the moon |
|
(b) Of strong gravity effect on TV signals |
|
(c) TV signals travel straight and cannot follow the curvature of the earth |
|
(d) There is atmosphere around the earth |
No bias is applied to a P-N junction, then the current
|
(a) Is zero because the number of charge carriers flowing on both sides is same |
|
(b) Is zero because the charge carriers do not move |
|
(c) Is non-zero |
|
(d) None of these |
If a radioactive substance reduces to ![]() of its original mass in 40 days, what is its half-life
of its original mass in 40 days, what is its half-life
|
(a) 10 days |
(b) 20 days |
(c) 40 days |
(d) None of these |
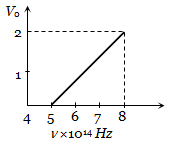
The stopping potential (![]() versus frequency (n) plot of a substance is shown in figure the threshold wave length is
versus frequency (n) plot of a substance is shown in figure the threshold wave length is
|
(a) 5 |
(b) 6000Å |
|
(c) 5000 Å |
(d) Can not be estimated from given data |