Question
The following graph represents the organismic response to certain environmental condition (e.g., temperature):
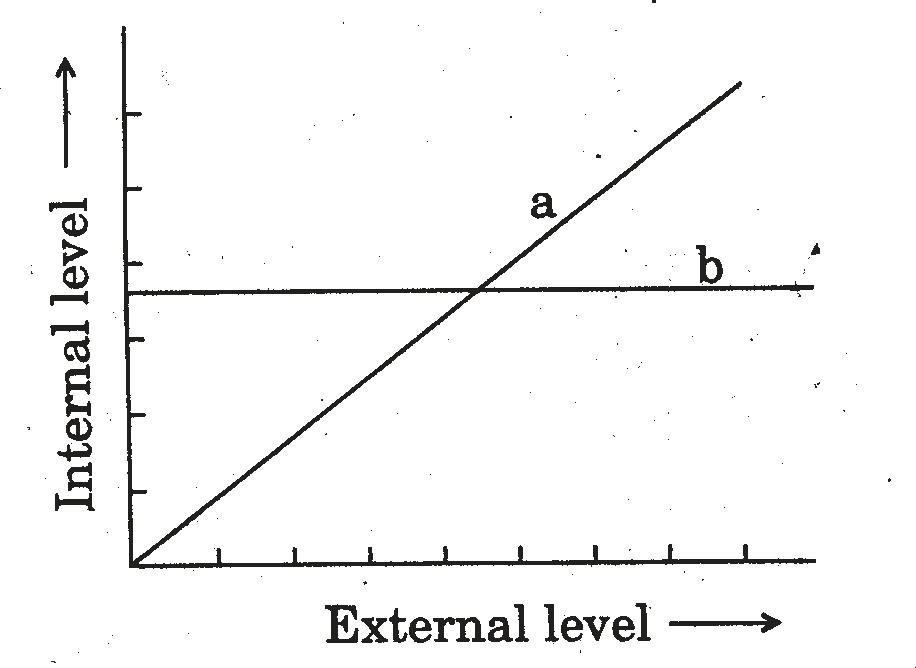
- Which one of these, ‘a’ or ‘b’, depicts conformers?
- What does the other line graph depict?
- How do these organisms differ from each other with reference to homoeostasis?
- Mention the category to which humans belong.