Question
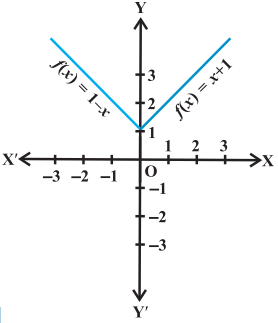
The function f is defined by $\begin{equation} f(x)=\left\{\begin{array}{ll} {1-x,} & {x<0} \\ {1} & {, x=0} \\ {x+1,} & {x>0} \end{array}\right. \end{equation}$
Draw the graph of f(x).

Answer

Here it is given that, f(x) = 1 – x, x < 0, this gives
f(– 4) = 1 – (– 4) = 5;
f(– 3) =1 – (– 3) = 4,
f(– 2) = 1 – (– 2) = 3
f(–1) = 1 – (–1) = 2; etc, and f(1) = 2, f (2) = 3, f (3) = 4
f(4) = 5 and so on for f(x) = x + 1, x > 0.
Thus, the graph of the given function f(x) is as shown in figure given below.

Need a full question paper?

Generate a complete, print-ready paper with questions like this in minutes — across 16+ boards, with answer keys.

Start Generating Free