Question
The graph given below represents a cooling curve fore a substance being cooled from a higher temperature to a lower temperature.
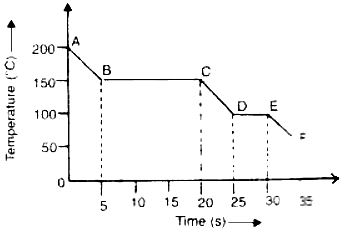
(a)What is the boiling point of the substance?
(b)What happens in the region DE?
(c)What is the melting point of the substance?
(a)What is the boiling point of the substance?
(b)What happens in the region DE?
(c)What is the melting point of the substance?