Question
The graph shows the maximum temperatures recorded for two consecutive weeks of a town. Study the graph and answer the questions that follow.
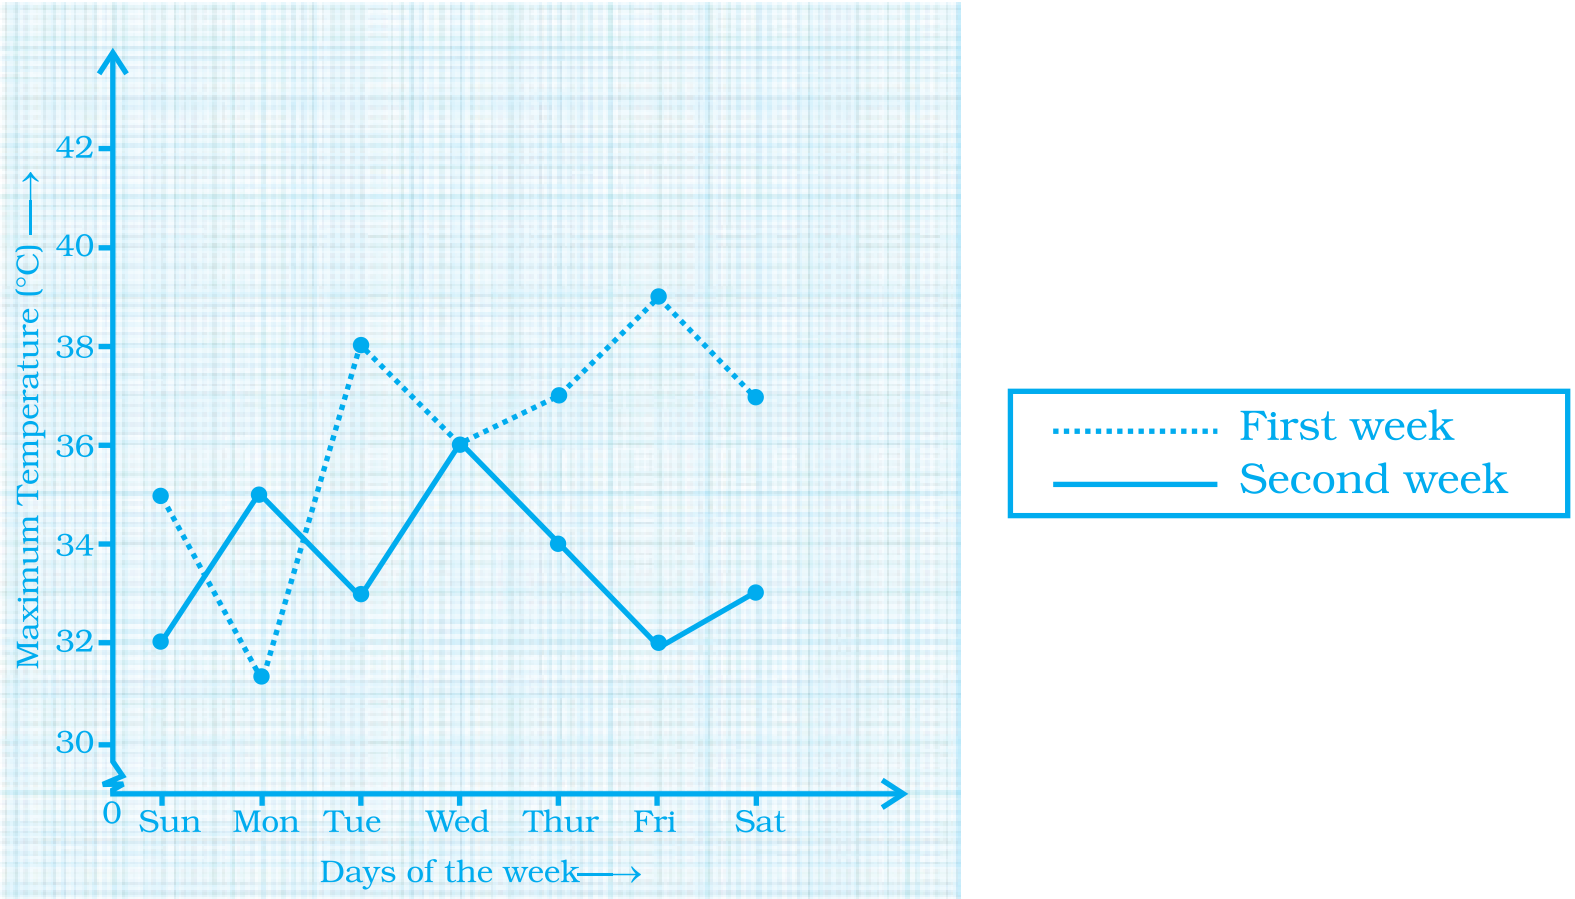
$a.$ What information is given by the two axes?
$b.$ In which week was the temperature higher on most of the days
$c.$ On which day was the temperature same in both the weeks
$d.$ On which day was the difference in temperatures the maximum for both the weeks?
$e.$ What were the temperatures for both the weeks on Thursday?
$f.$ On which day was the temperature $35^\circ C$ for the first week?
$g.$ On which day was the temperature highest for the second week?