MCQ
The graphs in figure show that a quantity $y$ varies with displacement $d$ in a system undergoing simple harmonic motion. Which graphs best represents the relationship obtained when $y$ is The time
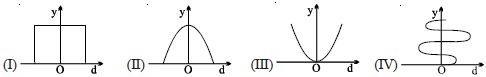
- A$I$
- B$II$
- C$III$
- ✓$IV$
Generate a complete, print-ready paper with questions like this in minutes — across 16+ boards, with answer keys.
$X \stackrel{a}{\longrightarrow} Y$
$Y \underset{2 \beta}{\longrightarrow} Z$
then