The graphs in figure show that a quantity $y$ varies with displacement $d$ in a system undergoing simple harmonic motion. Which graphs best represents the relationship obtained when $y$ is The total energy of the system
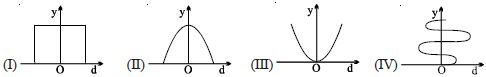
A$I$
B$II$
C$III$
D$IV$
Medium
Download our app for free and get started
A$I$
a The total energy of $SHM$ always remains constant. Hence, option $A$ is correct.
Download our app
and get started for free
Experience the future of education. Simply download our apps or reach out to us for more information. Let's shape the future of learning together!No signup needed.*
The amplitude and the periodic time of a $S.H.M.$ are $ 5\,cm$ and $6\,sec$ respectively. At a distance of $2.5\,cm$ away from the mean position, the phase will be
A ring is hung on a nail. It can oscillate, without slipping or sliding $(i)$ in its plane with a time period $T_{1}$ and, $(ii)$ back and forth in a direction perpendicular to its plane, with a period $T _{2}$. the ratio $\frac{ T _{1}}{ T _{2}}$ will be
Four massless springs whose force constants are $2k, 2k, k$ and $2k$ respectively are attached to a mass $M$ kept on a frictionless plane (as shown in figure). If the mass $M$ is displaced in the horizontal direction, then the frequency of oscillation of the system is
A $100 \,g$ mass stretches a particular spring by $9.8 \,cm$, when suspended vertically from it. ....... $g$ large a mass must be attached to the spring if the period of vibration is to be $6.28 \,s$.
A particle moves with simple harmonic motion in a straight line. In first $\tau \,s$, after starting from rest, it travels a distance $a$, and in next $\tau \,s$, it travels $2a$ in same direction then