MCQ
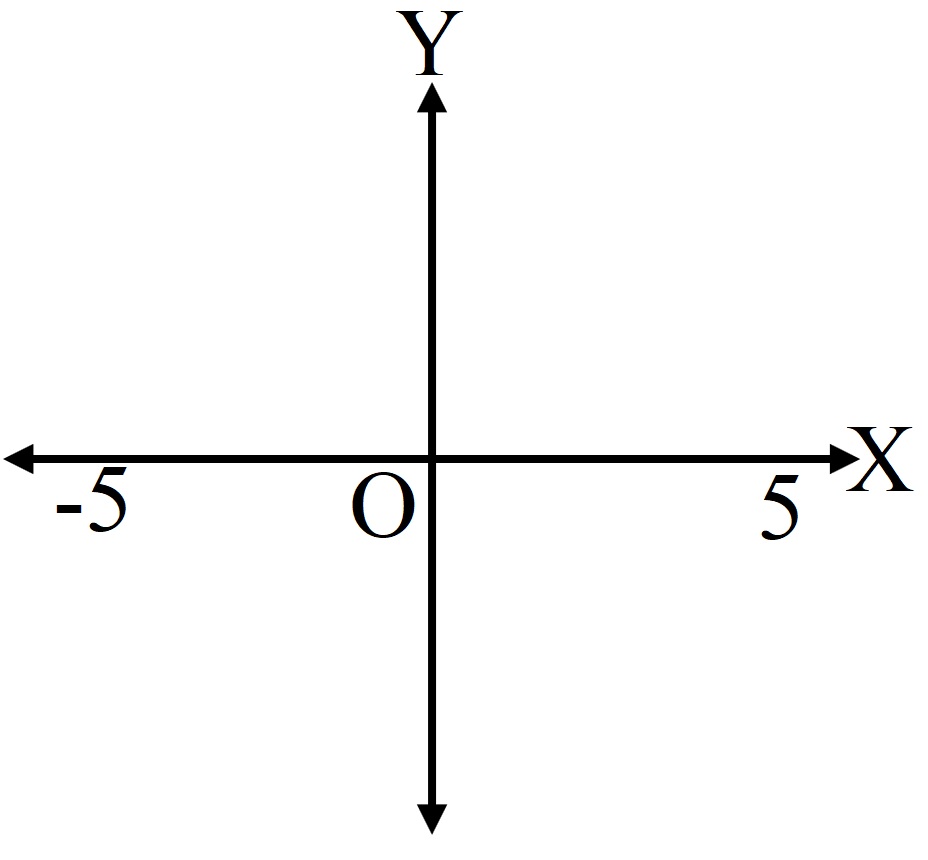
The inequality representing the following graph is:
- A|x| < 5
- B|x| ≤ 5
- C|x| > 5
- D|x| ≥ 5
Solution:
The given graph shows the shaded region corresponding to x > – 5 and x < 5.
Therefore, by combining the above two inequalities, we get |x| < 5.
Generate a complete, print-ready paper with questions like this in minutes — across 16+ boards, with answer keys.
The domain and range of the real function f defined by $\text{f(x)}=\frac{4-\text{x}}{\text{x}-4}$ is given by.
Equation of vertical line to the left of y-axis at 5 units from y-axis is: