The monthly profits (in Rs.) of 100 shops are distributed as follows:
Draw the frequency polygor it.
| Profits per shop | 0-50 | 50-100 | 100-150 | 150-200 | 200-250 | 250-300 |
| No. of shops | 12 | 18 | 27 | 20 | 17 | 6 |
Download our app for free and get started
|
Profits per shop
|
No. of shops (f)
|
c.f.
|
|
0-50
|
12
|
12
|
|
50-100
|
18
|
30
|
|
100-150
|
27
|
57
|
|
150-200
|
20
|
77
|
|
200-250
|
17
|
94
|
|
250-300
|
6
|
100
|
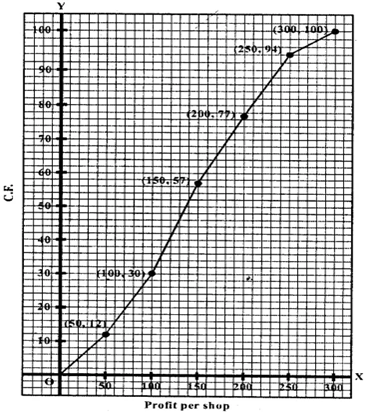 Represent profits per shop along x-axis and no. of shop (c.f.) along y-axis.
Plot the points (50, 12), (100, 30), (150, 57), (200, 77), (250, 94) and (300, 100) on the graph and join them with ruler. This is the cumulative polygon as shown.

Download our appand get started for free
Experience the future of education. Simply download our apps or reach out to us for more information. Let's shape the future of learning together!No signup needed.*
Similar Questions
- 1View SolutionThe following table gives production yield per hectare of wheat of 100 farms of a village:
Draw ‘less than’ ogive and ‘more than’ ogive.Production yield50-5555-6060-6565-7070-7575-80 in kg per hecctareNumber of farms2812243816 - 2View SolutionDraw an ogive to represent the following frequency distribution:Class-interval0-45-910-1415-1920-24No. of students261053
- 3View SolutionCalculate the mean for the following distribution:
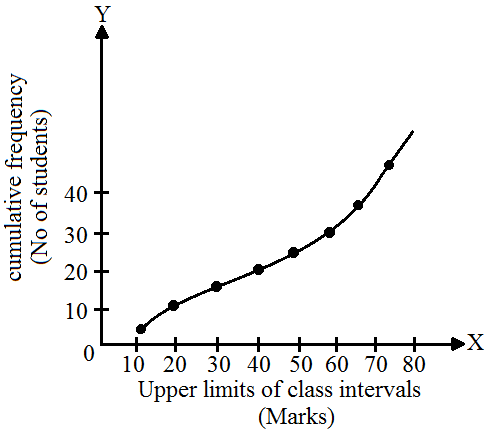
x 5 6 7 8 9 f 4 8 14 11 3 - 4View SolutionA student draws a cumulative frequency curve for the marks obtained by 40 students of a class as shown below. Find the median marks obtained by the students of the class.
- 5View SolutionThe shirt sizes worn by a group of 200 persons, who bought the shirt from a store, are as follows:
Find the model shirt size worn by the group.Shirt size 37 38 39 40 41 42 43 44 Number of persons 15 25 39 41 36 14 15 12 - 6View SolutionWrite the median class of the following distribution:Classes0-1010-2020-3030-4040-5050-6060-70Frequency448101284
- 7View Solutionfind the class marks of classes 10-25 and 35-55.
- 8View SolutionWrite the median class for the following frequency distribution:Class-interval0-1010-2020-3030-4040-5050-6060-7070-80Frequency5871228201010
- 9View SolutionFind the mode of the following distribution.Class-interval10-1515-2002-2525-3030-3535-40Frequency304575352515
- 10View Solutionn the graphical representation of a frequency distribution, if the distance between mode and mean isk times the distance between median and mean, then write the value of k.