Question
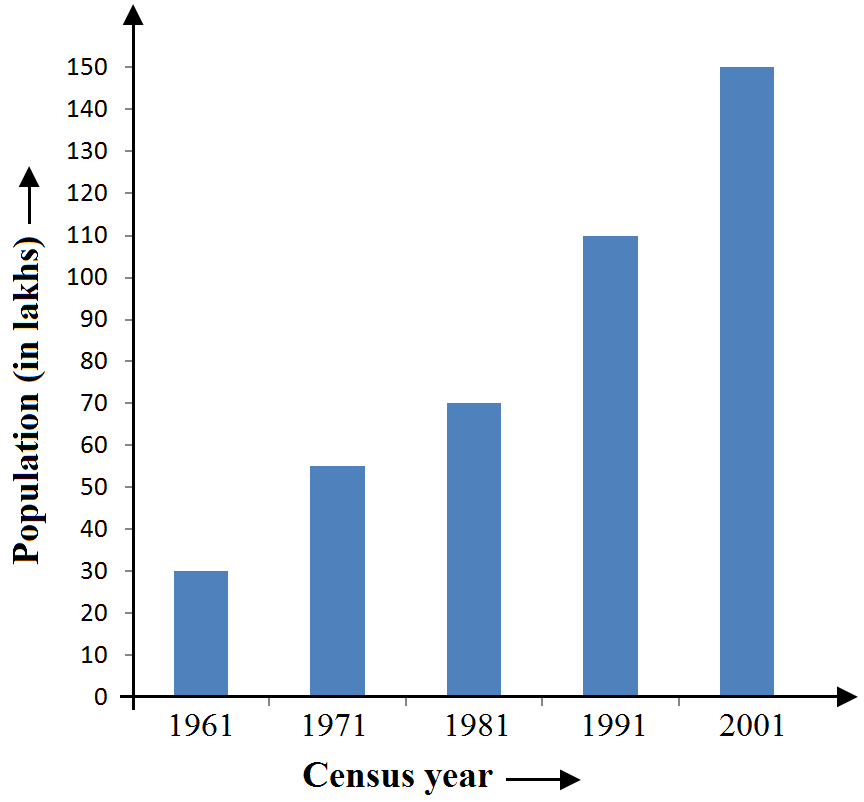
The population of Delhi State in different census years is as given below:
Census year
$1961$
$1971$
$1981$
$1991$
$2001$
Cars Sold
$30$
$55$
$70$
$110$
$150$
Represent the above information with the help of a bar graph.

Answer

To represent the given data on a bar graph, we should first draw a horizontal and a vertical line.
Here, the horizontal line will show the census year and the vertical line will show represent the population.
Since $5$ values or data are given, we mark $5$ points on the horizontal axis at equal distances and will erect rectangles of the same width with their heights proportional to the given data.
Also, on the vertical axis, each difference of $10$ will represent a population of $10$ lakhs.

Need a full question paper?

Generate a complete, print-ready paper with questions like this in minutes — across 16+ boards, with answer keys.

Start Generating Free