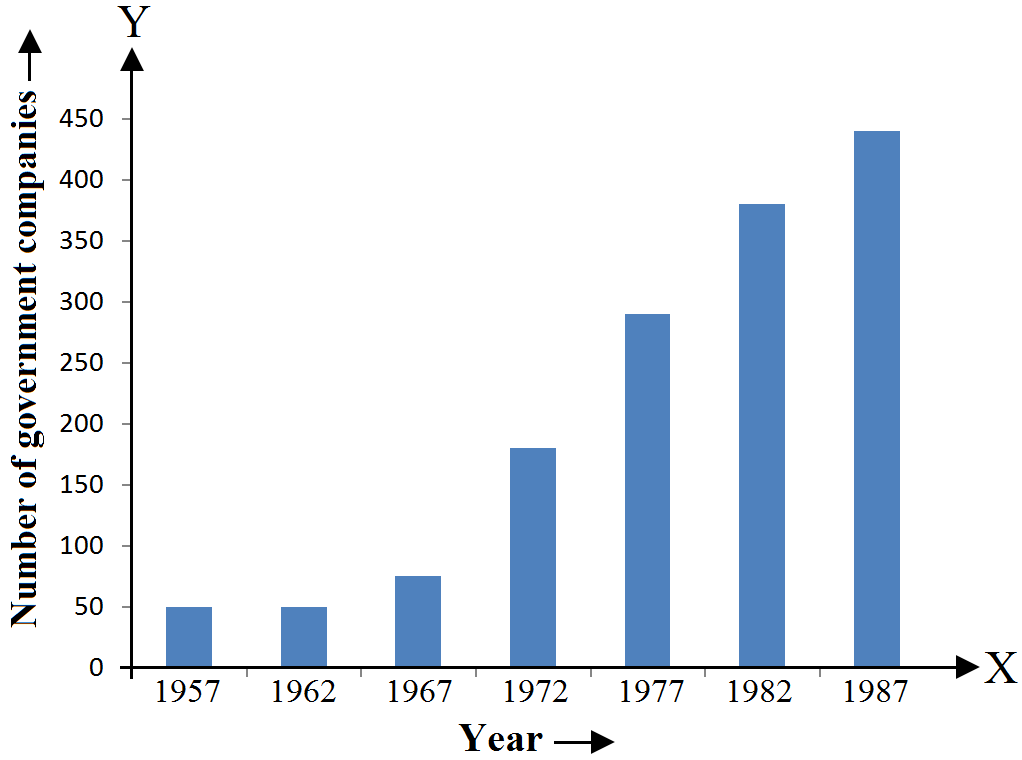
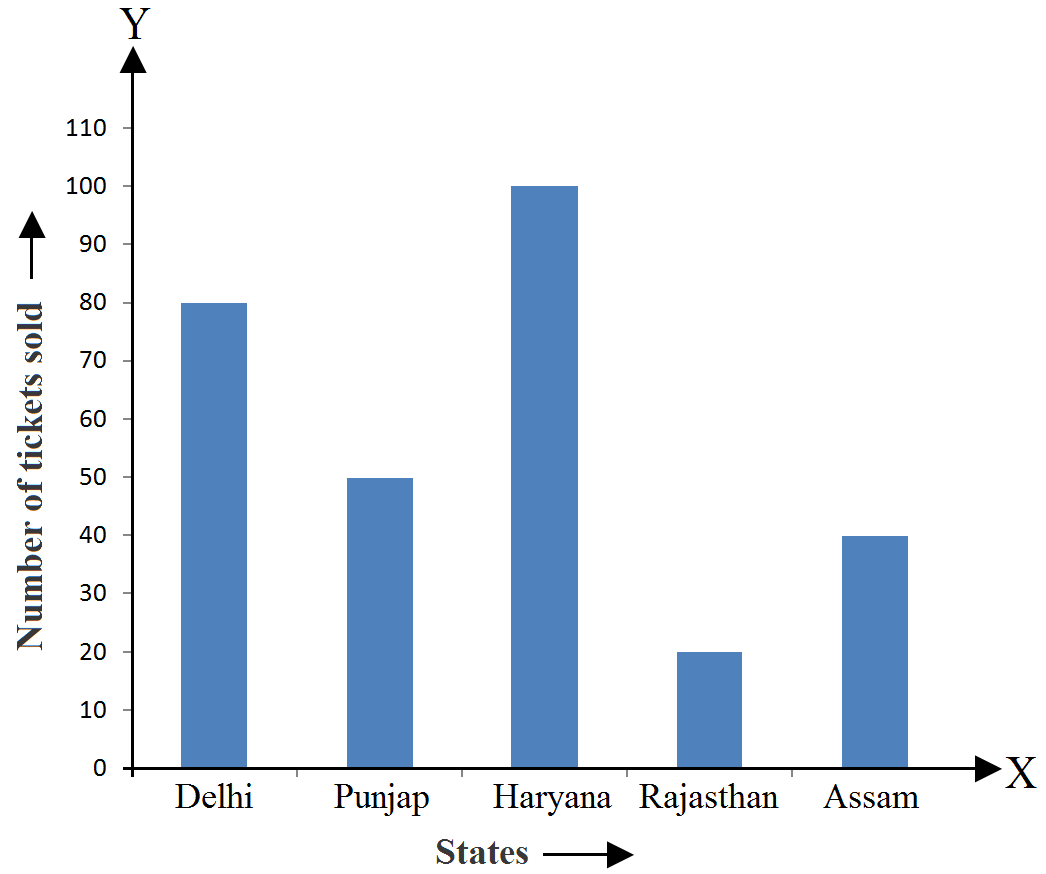
Read the following bar graph and answer the following questions:

$i.$ What is the information given by the bar graph?
$ii.$ State the following whether true or false.
The number of goverment companies in $1957$ is that of $1982$ is $1 : 9$
View full solution →$i.$ What is the information given by the bar graph?
$ii.$ State the following whether true or false.
The number of goverment companies in $1957$ is that of $1982$ is $1 : 9$