Question
Three speed-time graphs are given below: 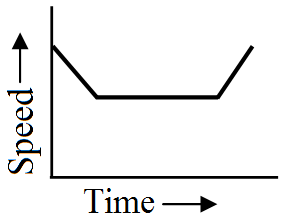
 Which graph represents the case of:
Which graph represents the case of:
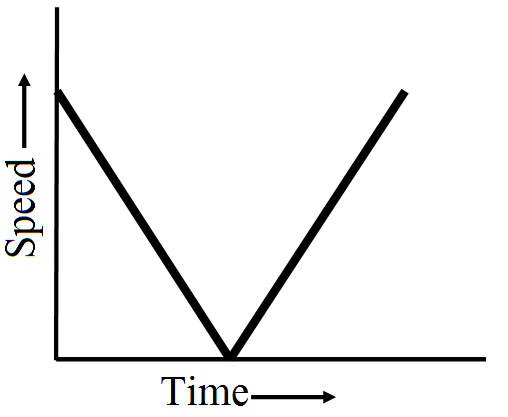
- A cricket ball thrown vertically upwards and returning to the hands of the thrower?
- A trolley decelerating to a constant speed and then accelerating uniformly?