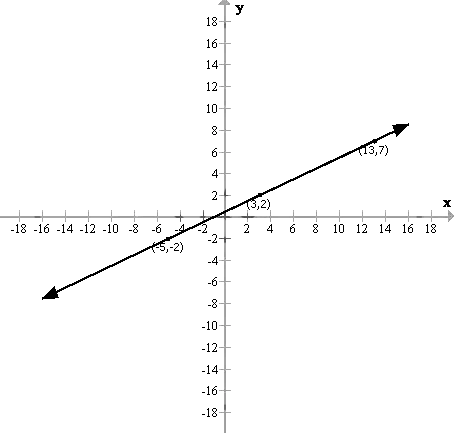
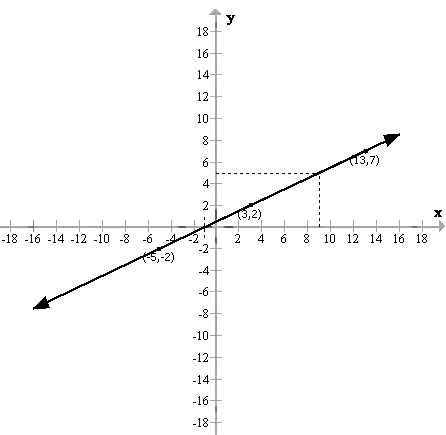
Question
Use the table given below to draw the graph.
$x$ $-5$ $-1$ $3$ $b$ $13$
$y$ $-2$ $a$ $2$ $5$ $7$
From your graph, find the values of $'a\ '$ and $'b\ '$.State a linear relationship between the variables $x$ and $y$.

Answer

The table is:
$X$ $- 5$ $- 1$ $3$ $b$ $13$
$Y$ $- 2$ $a$ $2$ $5$ $7$
Plotting the points as shown in the above table, we get the following required graph:

When $x = - 1$, then $y = 0$
$\Rightarrow a = 0$
When $y = 5$, then $x = 9$
$\Rightarrow b = 9$

Let $y = px + q\dots....(1)$
be a linear relation between$x$ and $y$
Substitute $x = 9$ and $y = 5$ in the equation $(1)$, we have,
$5 = 9p + q\dots....(2)$
Substitute $x = - 1$ and $y = 0$ in the equation $(1)$, we have,
$0 = - p + q \dots....(3)$
Subtracting $(3)$ from $(2)$, we have,
$5 = 10p$
$\Rightarrow p=\frac{5}{10}$
$\Rightarrow p=\frac{1}{2}$
From $(3)$, we have,
$p = q$
$\therefore q=\frac{1}{2}$
Thus, the linear relation is
$y = px + q$
$\Rightarrow y =\frac{1}{2} x+\frac{1}{2}$
$\Rightarrow y =\frac{x+1}{2}$

Need a full question paper?

Generate a complete, print-ready paper with questions like this in minutes — across 16+ boards, with answer keys.

Start Generating Free