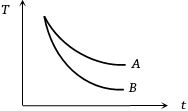
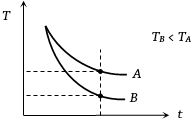
Water and turpentine oil (specific heat less than that of water) are both heated to same temperature. Equal amounts of these placed in identical calorimeters are then left in air
Medium


Download our appand get started for free
Experience the future of education. Simply download our apps or reach out to us for more information. Let's shape the future of learning together!No signup needed.*
Similar Questions
- 1rod of $40\, cm$ in length and temperature difference of ${80^o}C$ at its two ends. $A$ nother rod $B$ of length $60\, cm$ and of temperature difference ${90^o}C$, having the same area of cross-section. If the rate of flow of heat is the same, then the ratio of their thermal conductivities will beView Solution
- 2A cylindrical rod having temperature ${T_1}$ and ${T_2}$ at its ends. The rate of flow of heat is ${Q_1}$ $cal/sec$. If all the linear dimensions are doubled keeping temperature constant then rate of flow of heat ${Q_2}$ will beView Solution
- 3Temperature of water at the surface of lake is $ - {20^o}C$ Then temperature of water just below the lower surface of ice layer is ...... $^oC$View Solution
- 4A black body at $1227^o C$ emits radiations with maximum intensity at a wavelength of $5000\;\mathring A$ . If the temperature of the body is increased by $1000^o C$, the maximum intensity will be observed at ...... $\mathring A$View Solution
- 5View SolutionIf the radius and length of a copper rod are both doubled, the rate of flow of heat along the rod increases ....... times
- 6A body cools in $7$ minutes from $60^{\circ}\,C$ to $40^{\circ}\,C$. The temperature of the surrounding is $10^{\circ}\,C$. The temperature of the body after the next $7$ minutes will beView Solution
- 7The temperature at which a black body of unit area loses its energy at the rate of $1$ joule/second isView Solution
- 8Certain quantity of water cools from $70^o C$ to $60^o C$ in the first $5$ minutes and to $54^o C$ in the next $5$ minutes. The temperature of the surroundings is ..... $^oC$View Solution
- 9A black body is at a temperature of $5760\ K$. The energy of radiation emitted by the body at wavelength $250\ nm$ is $U_1$, at wavelength $500\ nm$ is $U_2$ and that at $1000\ nm$ is $U_3$. Wien's constant, $b = 2.88 \times 10^6\ nm\ K$. Which of the following is correct?View Solution
- 10View SolutionWhich factor does not affect convection?