Question
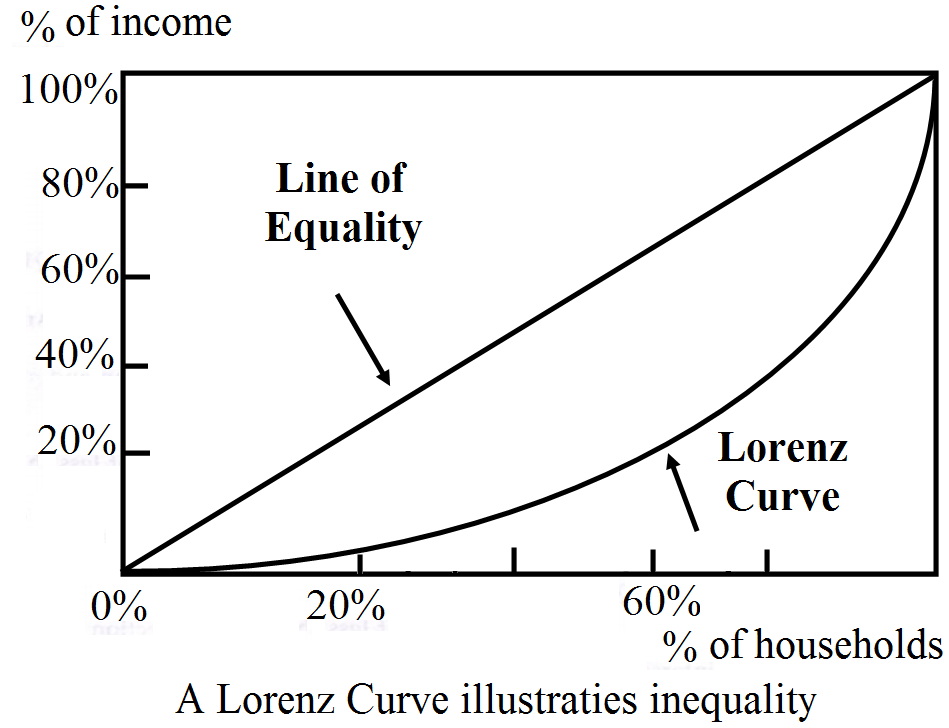
What is a Lorenz curve? What does it show?

Answer

This is a modification of the Ogive when the variables and the cumulative frequencies are expressed as percentages. It serves to measure the evenness of the distribution and is useful in picturing the distribution and dispersion of wealth, sales and profits etc. If we get a line which is a diagonal of the square, it implies that variable is evenly distributed amongst population. Farther is the line from this diagonal, higher is the inequality and vice versa.

Need a full question paper?

Generate a complete, print-ready paper with questions like this in minutes — across 16+ boards, with answer keys.

Start Generating Free

Similar questions

How is equilibrium price of a commodity affected by change in its supply?
A department store sells stereo systems, television sets and radios. The percentage distribution of the total sales volume (in ₹) is estimated as 30% stereos, 50% televisions and 20% radios. The price of one stereo, one television and one radio in 2009 was ₹ 20,000, ₹ 15,000 and ₹ 500 respectively, while their respective price in 2012 were ₹ 25,000, ₹ 20,000 and ₹ 800.
A weighted price index for 2012 with base 2009 is to be computed.
  1. Which index number formula is appropriate? Why?
  2. Compute the index.
Subsidies on food, fertilisers, export promotion and others given by the government are shown in the table below (in crores). Represent the data diagrammatically.
Year
Food
Fertilsers
Export Promotion
Others
Total
2006-07
2000
1897
788
891
5576
2007-08
2200
2210
960
909
6279
2008-09
2300
3000
1091
925
7316
Explain the concept of supply with the help of a table and figure.
A consumer's budget is ₹40. He is buying Good-1 and Good-2. Price of Good-1 is ₹8 per unit, and of Good-2 is ₹10 per unit. Draw a budget line on the basis of these figures.
Distinguish between classification and tabulation of data.
What are the different types of elasticity of supply?
Price elasticity of demand is found to be (-) 2. Price falls from ₹10 per unit to ₹8 per unit. Find the percentage change in quantity demanded.
Calculate the cost of living index from the following data:
Iteam
Price
Weight
Base Year
Current Year
Food
30
47
4
Fuel
8
12
1
Cloth
14
18
3
House Rent
22
15
2
Miscellancous
25
30
1
Define demand. State the factors affecting demand for a commodity by a consumer-