Question
What is a production possibility frontier?

Answer

The production possibility frontier (PPF) refers to a curve that shows the various combinations of two goods that an economy can produce with the available technology and given resources which are fully and efficiently employed. It is also called production possibility frontier because it shows the limit of what is possible to produce with present resources.Assumptions:
  1. Productive resources are given in an economy.
  2. All the resources are fully employed and efficiently utilised.
  3. Techniques of production are given and do not change.
  4. The resources are not equally efficient in production of all products.
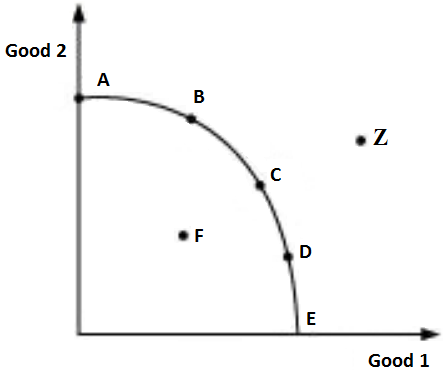
All the points lying on the PPC, that is curve AE, are associated with different quantities of good 1 and good 2 produced, by employing the available resources fully and in an efficient manner. While any point lying under the curve, like F, depicts inefficiency or under utilisation of available resources. Whereas any point lying outside the curve, like Z, depicts over utilisation of the available endowment of resources and technology; making it non-feasible.
This graph shows as we increase the production of Good 1, the production of Good 2 falls as there are limited resources in the economy. It means resources are transferred to the production of Good 1 by withdrawing them from Good 2 i.e., one commodity is transformed into the other, not physically but by transferring resources. Therefore, it is also called 'transformation curve'.

Need a full question paper?

Generate a complete, print-ready paper with questions like this in minutes — across 16+ boards, with answer keys.

Start Generating Free

Similar questions

A consumer consumes only two goods X and Y both priced at Rs. 3 per unit. If the consumer chooses a combination of these two goods with Marginal Rate of Substitution equal to 3, is the consumer in equilibrium? Give reasons. What will a rational consumer do in this situation? Explain.
Explain the effect of the following on the market demand of a commodity:
  1. Change in price of related goods.
  2. Change in the number of its buyers.
Explain with the help of diagram the effect of the following on the demand of a commodity.
  1. Fall in the price of a complementary good.
  2. Rise in the income of its buyer.
A consumer consumes only two goods $X$ and $Y$ whose prices are Rs. $4$ and Rs. $5$ per unit respectively. If the consumer chooses a combination of the two goods with marginal utility of $X$ equal to $5$ and that of $Y$ equal to $4$, is the consumer in equilibrium? Give reasons. What will a rational consumer do in this situation? Use utility analysis.
A consumer consumes only two goods $X$ and $Y$ both priced at $₹ 3$ per unit. If the consumer chooses a combination of these two goods with Marginal Rate of Substitution equal to $3$, is the consumer in equilibrium? Give reasons. What will a rational consumer do in this situation? Explain.
Explain effect of technological changes on supply of a product.
Calculate TR, AR and MR from the following data.
Units sold 10 9 8 7 6 5 4
Price (₹) 1 2 3 4 5 6 7
From the following total cost and total revenue schedule of a firm, find out the level of output, using marginal cost and marginal revenue approach, at which the firm would be in equilibrium. Give reasons for your answer.
Output (units) ₹ Total Revenue ₹ Total Cost ₹
1 10 8
2 18 15
3 24 21
4 28 25
5 30 33
Explain the difference between "Shift of Supply Curve" and "Movement along Supply Curve". State one factor responsible for each. Use diagrams.
Explain the relationship between Marginal product and Average product.
OR
State the relation between Marginal product and average product. Use diagram.