Question
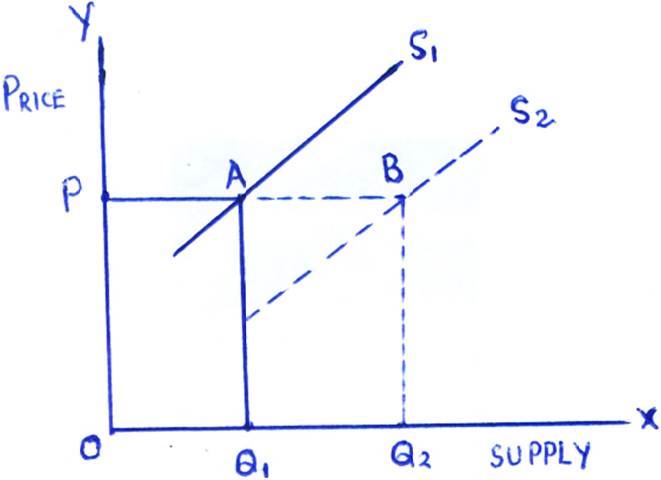
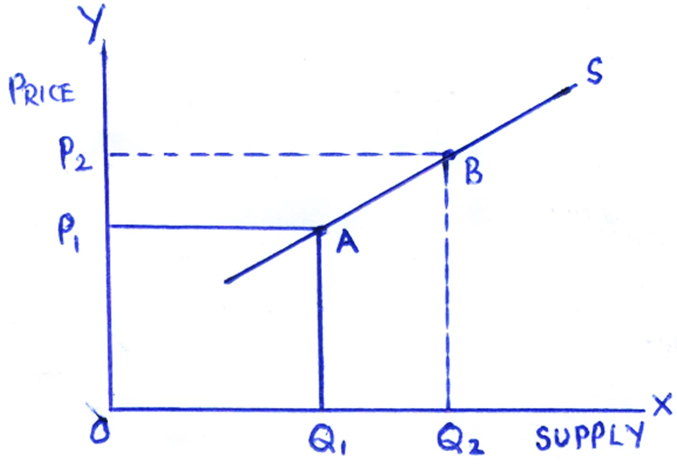
Explain the difference between "Shift of Supply Curve" and "Movement along Supply Curve". State one factor responsible for each. Use diagrams.

Answer

Shift of supply curve takes place when there is a change in supply due to a factor other than own-price of the good. For example, suppose tax rate on the good is reduced. This reduces cost and shifts the supply curve from $S_1$ to $S_2$. Price remaining unchanged. Supply increases from $OQ_1$ to $OQ_2$.
Movement along the supply curve takes place when there is change in own price of the good. Suppose own price rises, this expands supply. The change is shown along the same supply curve S, from A to B leading to change in quantity supplied from $OQ_1$ to $OQ_2$.

Need a full question paper?

Generate a complete, print-ready paper with questions like this in minutes — across 16+ boards, with answer keys.

Start Generating Free

Similar questions

Compare mean, median and mode as measures of central tendency. Discuss the situations when one is more suitable than other.
Find out the missing value of the variate for the following distribution whose mean is 31.87.
Value (X)12202733?54
Frequency (f)8164890308
Explain producer's equilibrium with the help of a diagram.
A firm's average fixed cost, when it produces 2 units, is ₹ 30. Its average total cost schedule is given below. Calculate its marginal cost and average variable cost at each level of output.
Output (Units) 1 2 3
Average Total Cost (₹) 80 48 40
Explain with the help of diagrams, the effect of the following changes on the demand for a commodity:
  1. A fall in the price of substitute goods.
  2. A fall in the income of its buyer.
Draw Average Variable Cost (AVC), Average Total Cost (ATC) and Marginal Cost (MC) curves in a single diagram. State the relation between MC curve and AVC & ATC curves.
If equilibrium price of a good is greater than its market price, explain all the changes that will take will place in the market. Use diagram.
How are equilibrium price and quantity affected when income of the consumers:
  1. increase?
  2. decrease?
The total fixed cost of a firm is ₹ 12. Given below is its marginal cost schedule. Calculate total cost and average variable cost for each given level of output.
Output
1
2
3
4
5
6
Marginal Cost ()
9
7
2
4
8
12
Giving reasons, classify the following into fixed costs and variable costs.
  1. Wages to the daily wage workers.
  2. Salary of the permanent staff.
  3. Expenditure on purchase of raw materials.
  4. Interest on borrowed capital.
  5. Electricity Meter rent.
  6. Sales Tax.