Question
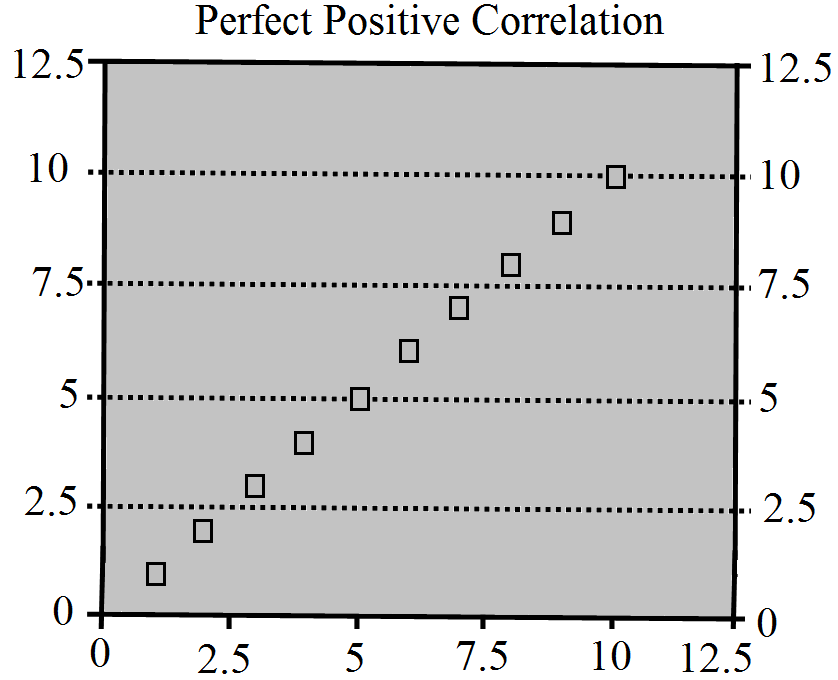
What is a scatter diagram? Draw scatter diagram for perfect positive correlation.

Answer

In this method the values of the two variables are plotted on a graph paper. One is taken along the horizontal (x-axis) and the other along the vertical (y-axis). By plotting the data, we get points (dots) on the graph which are generally scattered and hence the name Scatter Plot'.
The manner in which these points are scattered, suggest the degree and the direction of correlation. The degree of correlation is denoted by 'r' and its direction is given by the signs positive and negative.

Need a full question paper?

Generate a complete, print-ready paper with questions like this in minutes — across 16+ boards, with answer keys.

Start Generating Free