Questions

3 Marks Question

🎯

Test yourself on this topic

43 questions · timed · auto-graded

Question 13 Marks
Does correlation imply causation?
Answer
No, correlation does not imply causation. The correlation between the two variables does not imply that one variable causes the other. In other words, cause and effect relationship is not a prerequisite for the correlation. Correlation only measures the degree and intensity of the relationship between the two variables, but surely not the cause and effect relationship between them.
View full question & answer
Question 23 Marks
Give the advantages and disadvantages of Spearman's Rank Correlation.
Answer
The advantages of Spearman's Rank Correlation are:
  1. This method is simple to calculate and easy to understand.
  2. This method can be used in qualitative facts.
  3. If ranks are given and the actual values are missing, then also this method can be used.
The disadvantages of Spearman's Rank Correlation are:
  1. It cannot be used for computing correlation in case of grouped frequency distribution.
  2. It can be used conveniently only when the number of observation is small.
View full question & answer
Question 33 Marks
Explain Spearman's Rank Correlation method.
Answer
Rank correlation method was developed by Charles Edward Spearman. It is based on the ranking of various values of the variables. This method is specially useful in cases where quantitative measurement of certain variables such as intelligence, beauty, honesty, etc. is not possible but such variables can be assigned ranks. The following formulae is used for the computation of rank correlation coefficient:$\text{r}_\text{k}=1-\frac{6\Sigma\text{D}^2}{\text{n}^3-\text{n}}$ (When rank are not repeated)
$\text{r}_\text{k}=\frac{6\bigg[\Sigma\text{D}^2+\frac{(\text{m}^3_1-\text{m}_1)}{12}+\frac{(\text{m}^3_2-\text{m})}{12}+\dots\bigg]}{\text{n}^3-\text{n}}$ (When ranks are repeated).
View full question & answer
Question 43 Marks
Why is r preferred to covariance as a measure of association?
Answer
"r" i.e. correlation coefficient is preferred to covariance as a measure of association because
  • r is independent of change in scale and origin.
  • r has a specific range (-1 to +1 ), so it comes handy to interpret the results quickly.
  • Covariance is a part of correlation coefficient.
View full question & answer
Question 53 Marks
The sum of squares of the difference between ranks obtained in English and Economics of 10 students is 33. Calculate rank correlation coefficient.
Answer
$\text{r}_\text{s}=1-\frac{6\Sigma\text{D}^2}{\text{N}^3-\text{N}}$$=1-\frac{6\times33}{10^3-10}=1-\frac{198}{990}=0.80$
View full question & answer
Question 63 Marks
Does zero correlation mean independence?
Answer
No, Zero correlation does not mean absence of correlation but it means absence of linear correlation. There may be a non linear relationship between two variables but variables which have non linear relationship will depict zero correlation when put to scatter diagram and low correlation when used Pearson's or Spearman's method. Consider a shape as shown below:
It will be taken as zero correlation but to a certain level, X and Y are positively related and thereafter their relationship becomes negative.
View full question & answer
Question 73 Marks
What is Scatter Diagram and how is it useful in the study of correlation?
Answer
"Scatter Diagram” is a graphic method of finding out correlation between the two variables. For constructing a scatter diagram, X-variable is represented on the x-axis and Y-variable on y-axis. Each pair of values is plotted. Different plotted points may be scattered in various directions whose analysis gives us an idea of the type and magnitude of correlation:Scatter diagram is a useful technique for visually:
  • Examining the form of relationship, without calculating any numerical value.
  • We can get a fairly good idea of the relationship between the variables from the scatter diagram.
View full question & answer
Question 83 Marks
Can simple correlation coefficient measure any type of relationship?
Answer
No, the simple correlation coefficient cannot measure any type of relationship. The simple correlation coefficient can measure only the direction and magnitude of linear relationship between the two variables. It cannot measure non-linear relationship like quadratic, trigonometric, cubic, etc. Therefore, in such cases, the purview of simple correlation coefficient falls short.
For example: The simple correlation coefficient may depict that $X$ and $Y$ are not correlated in the equation $X = Y^2$, hence it may be concluded that both the variables are independent, but such conclusion may be wrong.
View full question & answer
Question 93 Marks
Differentiate between degree and direction of correlation.
Answer
Degree of correlation measures the extent to which items are correlated. Nearer is the value of r to 1 higher is the degree of correlation, nearer is the value of r to zero, closer is the value of r to zero. Direction is indicated by sign of + or - A + sign indicates positive correlation- i.e. when x increases, y increases and vice verca and a - sign shows negative correlation i.e. when x increases, y decreases and vice versa.
View full question & answer
Question 103 Marks
Differentiate between correlation and causation.
Answer
The difference between correlation and causation is that correlation is the mutual relation that exists between two or more things while causation is the fact that something causes an effect. The correlation between two variables does not imply that one is as a result of the other. Two or more variables considered to be related, in a statistical context, if their values change so that as the value of one variable increases or decreases so does the value of the other variable (although it may be in the opposite direction). For example, for the two variables "hours worked" and "income earned" there is a relationship between the two if the increase in hours worked is associated with an increase in income earned. If we consider the two variables "price" and "purchasing power", as the price of goods increases a person's ability to buy these goods decreases (assuming a constant income). But we cannot say that one is the cause of other.
View full question & answer
Question 113 Marks
What are the merits and limitations of Karl Pearson's product moment correlation?
Answer
Merits:
  1. Knowledge of Direction of Correlation: Pearson's co-efficient of correlation gives to the knowledge about the direction of relationship whether it is positive or negative.
  2. Size of Correlation: This method also indicates the size of relationship between the variables i.e. correlation ranges between +1 and -1.
  3. Ideal Measure: It is an ideal measure of correlation because it is based on most important statistical measures like mean and standard deviation.
Demerits:
  1. Difficult to calculate: Karl Pearson's method is a complicated method and involves complex calculations.
View full question & answer
Question 123 Marks
State the merits of Spearman's Rank Correlation.
Answer
The merits of rank correlation method are:
  1. It is simple to calculate and easy to understand.
  2. This method is very useful when the data is of qualitative nature.
  3. When ranks are given instead of actual data, this is the only method for finding out the degree of correlation.
View full question & answer
Question 133 Marks
Calculate Karl Pearson's coefficient of correlation between X and Y from the following data:
$\text{N}=8,\overline{\text{X}}=11,\overline{\text{Y}}=10,\Sigma\text{(X}-\overline{\text{X}})^2=184, \Sigma(\text{Y}-\overline{\text{Y}})=148,$
Answer
XUvmgf,jhgfkd
View full question & answer
Question 143 Marks
"The degree of closeness of scatter points and their overall direction gives us an idea of the nature of the relationship between variables. Explain.
Answer
Scatter diagram is a graphic method of studying correlation. To construct a scatter diagram, X variable is taken on X-axis and Y variable is taken on Y-axis. The cluster of points, so plotted is referred to as a scatter diagram. In a scatter diagram, the degree of closeness of scatter points and their overall direction gives us an idea of the nature of the relationship.
It is stated in the points below:
  1. If the dots move from left to right, in an upward direction then correlation is said to be positive whereas the movement of dots from left to right downwards indicates negative correlation.
  2. Dots in a straight line indicate perfect correlation.
  3. Dots falling close to each other in a straight line indicate high degree of correlation.
View full question & answer
Question 153 Marks
What is correlation ? Distinguish between positive and negative correlation.
Answer
Correlation studies and measures the direction and intensity of relationship among variables. If the two variables X and Y move in the same direction, i.e., with an increase in one variable, the other variable also increases or with the fall in one variable, the other variable also falls, the correlation is said to be positive. E.g. When the income rises, consumption also rises. There is a positive correlation between them.
Whereas if the two variables X and Y move in the opposite direction, i.e., with the increase in one variable, the other variable falls or with the fall in one variable, the other variable rises, the correlation is said to be "Negative correlation”.
E.g. When the price of a commodity rises, its demand falls. There is a negative correlation between them.
View full question & answer
Question 163 Marks
The following results are obtained regarding two series. Compute coefficient of correlation, when sum of products of deviations of X and Y series from their respective mean is 122.
 
X series
Y series
Number of item
15
15
Arithmetic Mean
25
18
Standerd Deviation
3.01
3.03
Answer
We are given that, $\text{n}=15,\overline{\text{X}}=25,\sigma_\text{x}=3.01,$$\overline{\text{Y}}=18,\sigma_\text{y}=3.03$
$\text{and}\ \Sigma\text{xy}=122 $
$\text{r}=\frac{\Sigma\text{xy}}{\text{n}.\sigma_\text{x}.\sigma_\text{y}}=\frac{122}{15\times3.01\times3.03}=\frac{122}{136.80}=0.89$
View full question & answer
Question 173 Marks
What is spurious correlation? Give some examples.
Answer
When two variables reflect correlation statistically but logically we can't expect them to be correlated, it is called spurious correlation. Two examples are as follows:
  1. Where there were more doctors, death rates were high.
  2. When there was high rainfall, more students has A grades.
  3. Number of storks and birth rate in Denmark.
  4. Number of priests in America and alcoholism.
  5. In the start of the 20th century it was noted that there was a strong correlation between 'Number of radios' and 'Number of people in Insane Asylums'.
View full question & answer
Question 183 Marks
What do you understand by 'spurious' or 'non-sense' correlation?
Answer
If there is no evident or sensible connection between two variables, then the correlation between these variables is said to be spurious, non-sense or chance correlation. For example correlation between rainfall recorded and production of steel. These two variables are not connected by any way. So, the correlation between these variables is said to be spurious.
View full question & answer
Question 193 Marks
Calculate Karl Pearson's coefficient of correlation between X and Y from the following data:$\text{n}=8,\overline{\text{X}}=11,\overline{\text{Y}}=10\Sigma\text{x}^2=184,\Sigma\text{y}^2=148,$
$\Sigma\text{xy}=164$
Answer
Given that,$\text{n}=8,\overline{\text{X}}=11,\overline{\text{Y}}=10\Sigma\text{x}^2=184,\Sigma\text{y}^2=148\text{ and}$
$\sum\text{xy}=164.$ Applying the formula,
$\text{r}=\frac{\Sigma\text{xy}}{\sqrt{\Sigma\text{x}^2\Sigma\text{y}^2}}=\frac{164}{\sqrt{184\times148}}$
$=\frac{164}{\sqrt{27232}}=\frac{164}{164.02}=0.99$
View full question & answer
Question 203 Marks
The following results are obtained regarding two series. Compute coefficient of correlation:
 
X-series
Y-series
No. of items
15
15
Arithmetic Mean
25
18
Standerd Devation
3.01
3.03
Sum of products of deviations of X and Y series from their respective mean is 122.
Answer
We are given: $\text{N}=15,\overline{\text{X}}=25\sigma_\text{x}=3.01$$\overline{\text{Y}}=18\sigma_\text{y}=3.03\ \text{and}\ \Sigma\text{XY}=122$
$\text{r}=\frac{\Sigma\text{xy}}{\text{N}\times\sigma_\text{x}\times\sigma_\text{y}}=\frac{122}{15\times3.01\times3.03}$
$\frac{122}{136.8}=0.89$
High degree correlation exists between the X and Y series.
View full question & answer
Question 213 Marks
What is Karl Pearson's coefficient of correlation? State its properties.
Answer
Karl Pearson's coefficient of correlation, denoted by rk, measures the degree and direction of relationship between two variables. It is calculated as :$\text{r}_\text{k}=\frac{\Sigma\text{xy}}{\text{N}.\sigma_\text{x}.\sigma_\text{y}} \ \text{or}\ \frac{\Sigma\text{xy}}{\sqrt{\Sigma\text{x}^2}\sqrt{\Sigma\text{y}^2}}$
$\text{r}_\text{k}=\frac{\Sigma(\text{X}-\overline{\text{X}})(\text{Y}-\overline{\text{Y}})}{\sqrt{\Sigma(\text{X}-\overline{\text{X}})^2}\sqrt{\Sigma(\text{Y}-\overline{\text{Y}})^2}}$
$\text{where, x}=\text{X}-\overline{\text{X}},\text{y}=\text{Y}-\overline{\text{Y}}$
Properties of Karl Pearson's coefficient of correlation:
  1. The value of correlation coefficient lies between -1 and +1. Symbolically, -1
  2. Correlation coefficient is independent of the change of origin and scale, i.e., the value of ‘r, 'is unaffected by the change of origin and scale.
  3. If r = 0, the two variables are not related. There is no linear relationship between them. They are independent.
View full question & answer
Question 223 Marks
What are the properties of Spearman's Rank Correlation?
Answer
The properties of Spearman's Rank Correlation are:
  1. Spearman's rank correlation also lies between +1 and -1.
  2. It is not affected by either change in scale or change in origin.
View full question & answer
Question 233 Marks
What are the properties of Karl Pearson's Coefficient of Correlation?
Answer
The properties of Karl Pearson's Coefficient of Correlation are:
  1. Karl Pearson's Correlation coefficient r has no unit. It is a pure number. It means unit of measurement is not a part of r.
  2. A negative value of r indicates an inverse relation. A change in one variable is associated with change in the other variable in the opposite direction.
  3. If r is positive it indicates a direct relation and the two variables move in the same direction.
  4. The value of the correlation coefficient lies between minus one and plus one i.e., $-1\leq\text{r}\leq1.$ If the value of r lies outside this range, it indicates there is some error in calculation.
  5. The value of r is unaffected by the change of origin and change of scale. Therefore, if the data is too large, step deviation method is used, which makes the calculation of correlation coefficient easy.
View full question & answer
Question 243 Marks
Give the advantages of Karl Pearson's coefficient of correlation.
Answer
The advantages of Karl Pearson's coefficient of correlation are:
  1. Karl Pearson's coefficient of correlation indicates the relationship as positive or negative and thus direction of the relationship can be ascertained.
  2. This measure gives summarised and precise quantitative figure of correlation which can be interpreted easily and can provide meaningful results.
  3. This coefficient of correlation indicates the direction and also the degree of relationship between the two variables. It shows whether the relationship is high, moderate or low.
View full question & answer
Question 253 Marks
Draw a scatter diagram and interpret whether the correlation is positive or negative.
X
4
5
6
7
8
9
10
11
12
13
14
15
Y
78
72
66
60
54
48
42
36
30
24
18
12
Answer
The pair of points are (4, 78), (5, 72), (6, 66), (7, 60), (8, 54), (9, 48), (10, 42), (11, 36), (12, 30), (13, 24), (14, 18) and (15, 12). Now we plot the points on a graph paper, which is shown below:
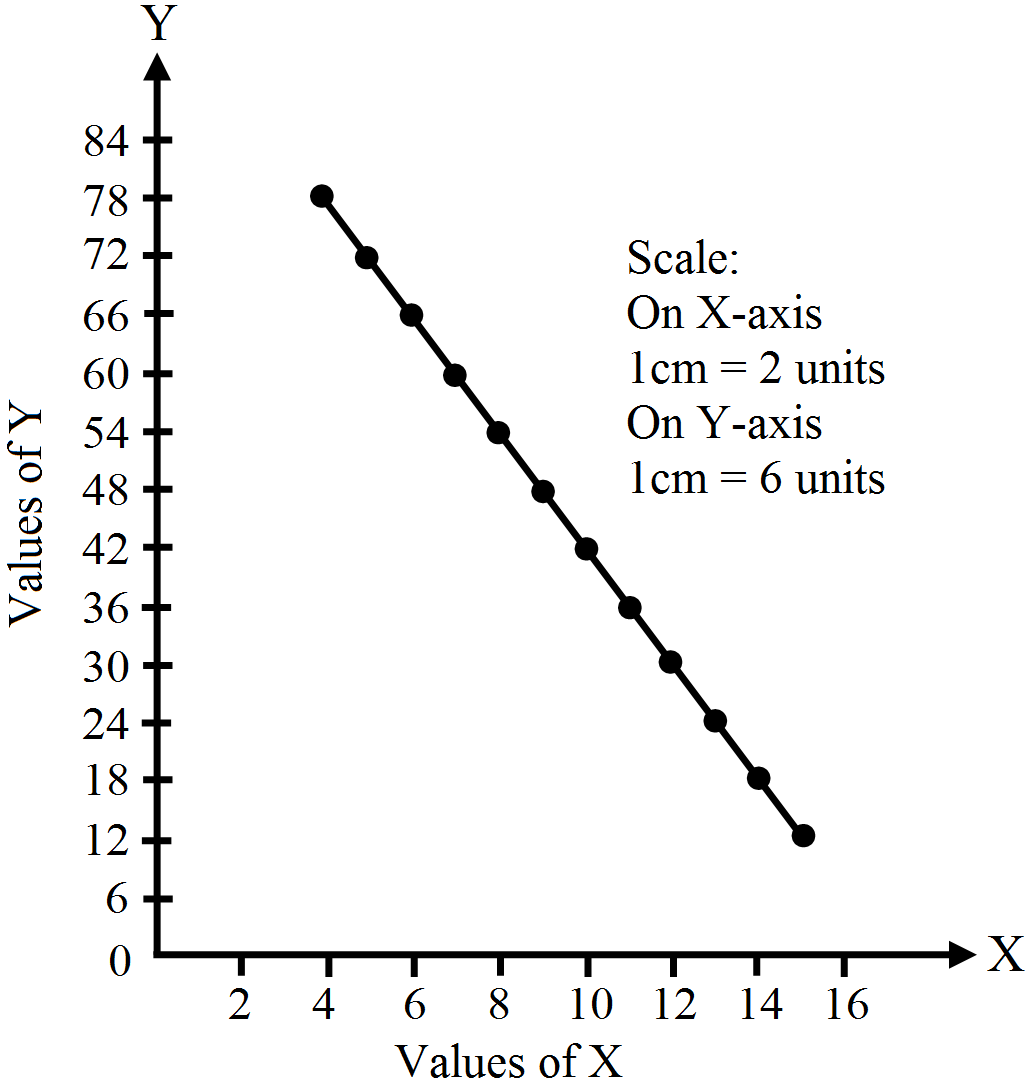
The diagram indicates that there is perfect negative correlation between the values of the two variables X and Y.
View full question & answer
Question 263 Marks
If the covariance between two variables X and Y is 8 and variance of X and Y are respectively 25 and 36, find the correlation coefficient.
Answer
$\text{r}=\frac{\text{Cov. (X,Y)}}{\sqrt{\text{Var. (X)}}\sqrt{\text{Var. (Y)}}}=\frac{8}{\sqrt{25}\sqrt{36}}$$\frac{8}{5\times6}=\frac{8}{30}=0.26$
Inference: Very low degree of correlation exists between X and Y variables.
View full question & answer
Question 273 Marks
Draw a scatter diagram and indicate the nature of correlation.
X 10 20 30 40 50 60 70 80
Y 5 10 15 20 25 30 35 40
Answer
Now, we plot the points on a graph paper which is shown below:
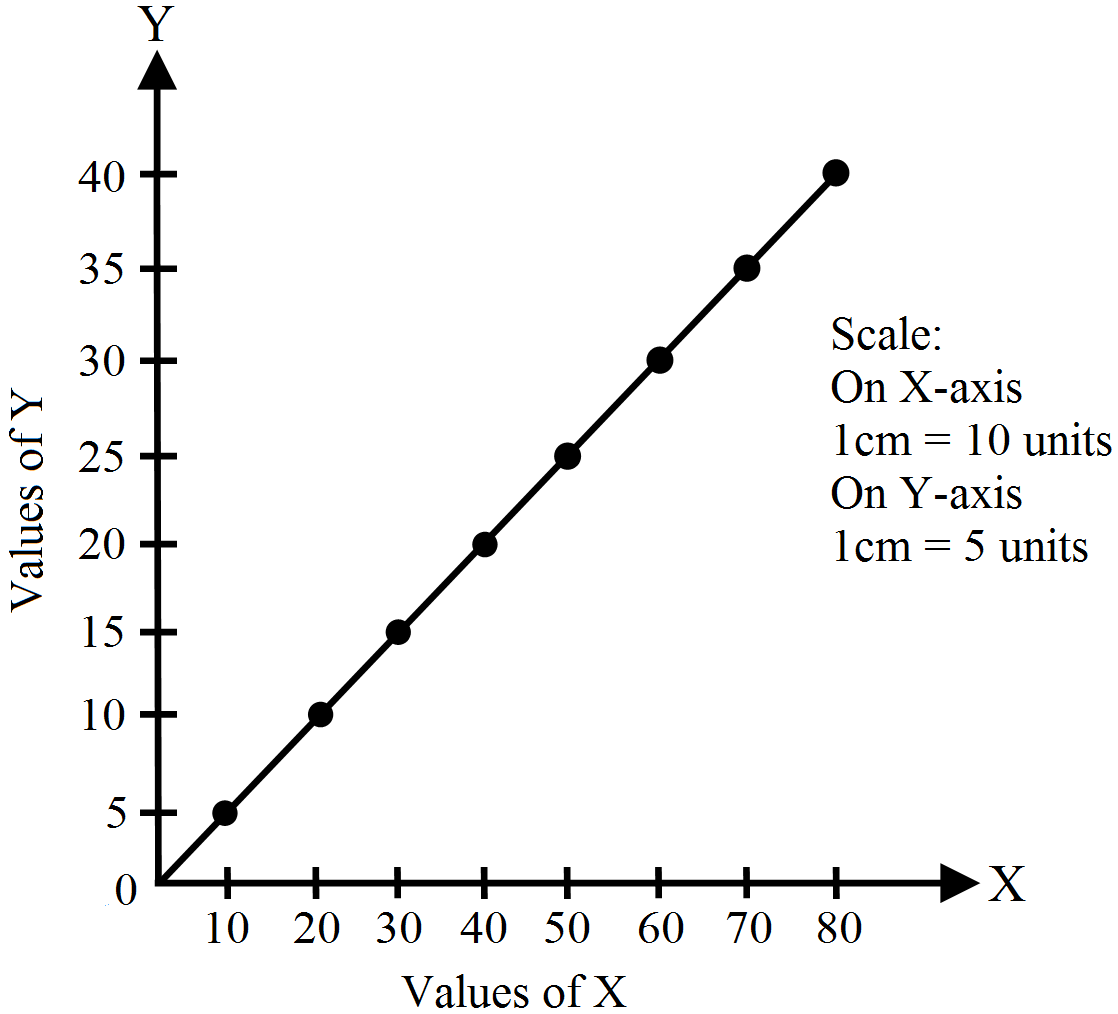
The diagram indicates that there is perfect positive correlation between the values of the two variables X and Y.
View full question & answer
Question 283 Marks
What are assumptions taken by Karl Pearson's while developing his coefficient of correlation?
Answer
Following assumptions are taken by Karl Pearson's while developing his coefficient of correlation:
  1. The correlation coefficient is symmetrical with respect to X and Y i.e. $^\gamma\text{XY}=\ ^\gamma\text{YX}$
  2. The correlation coefficient is independent of origin and unit of measurement i.e. $^\gamma\text{XY}=\ ^\gamma\text{UV}.$
  3. The correlation coefficient lies between -1 and 1 i.e. $-1\leq\gamma\leq+1.$
View full question & answer
Question 303 Marks
What is the difference between simple, partial and multiple correlation?
Answer
Simple Correlation: When there are only two variables involved in a problem, it is called simple correlation. For example, study of correlation between height and weight is simple correlation.
Partial Correlation: when we study two variable keeping some other variables which have an influence constant, it is called partial correlation. For example, if we study price rise with reference to only crop failure, keeping other factors like external factors, government policies constant, it is partial correlation.
Multiple Correlation: When we study relationship between two or more variables simultaneously, it is called multiple correlation. For example, study of price rise with crop failure and weaknesses of government policies.
View full question & answer
Question 313 Marks
Compute coefficient of correlation from the following data:
 
X-seires
Y-series
Mean
15
28
Sum of Squares of deviations from mean
144
225
Sum of products of deviations of X and Y series from their respective mean is 20. Number of pairs of observations is 10.
Answer
Given: $\Sigma(\text{X}-\overline{\text{X}})^2=144, \Sigma(\text{Y}-\overline{\text{Y}})^2=225,$$\Sigma(\text{X}-\overline{\text{X}})(\text{Y}-\overline{\text{Y}})=20,\text{N}=10$
$\text{r}=\frac{\Sigma\text{(X}-\overline{\text{X}})(\text{Y}-\overline{\text{Y}})}{\sqrt{\Sigma\text{(X}-\overline{\text{X}}) ^2}\sqrt{\Sigma(\text{Y}-\overline{\text{Y}})^2}}$
$=\frac{20}{\sqrt{144}\sqrt{225}}=\frac{20}{180}=0.11$
The degree of correlation between the variables X and Y is very low.
View full question & answer
Question 323 Marks
Calculate Karl Pearson's coefficient of correlation between X and Y from the following data:$\text{N}=8,\overline{\text{X}}=11,\overline{\text{Y}}=10,\Sigma\text{(X}-\overline{\text{X}})^2=184, \Sigma(\text{Y}-\overline{\text{Y}})\\=148, \Sigma(\text{X}-\overline{\text{X}})(\text{Y}-\overline{\text{Y}})=164.$
Answer
Applying the formula:$\text{r}=\frac{\Sigma(\text{X}-\overline{\text{X}})(\text{Y}-\overline{\text{Y}})}{\sqrt{\Sigma(\text{X}-\overline{\text{X}})^2}\sqrt{\Sigma(\text{Y}-\overline{\text{Y}})^2}}$
$=\frac{164}{\sqrt{184}\sqrt{148}}=\frac{164}{13.56\times12.16}=\frac{164}{164.88}=0.99$
View full question & answer
Question 333 Marks
What is a scatter diagram? Draw scatter diagram for perfect positive correlation.
Answer
In this method the values of the two variables are plotted on a graph paper. One is taken along the horizontal (x-axis) and the other along the vertical (y-axis). By plotting the data, we get points (dots) on the graph which are generally scattered and hence the name Scatter Plot'.
The manner in which these points are scattered, suggest the degree and the direction of correlation. The degree of correlation is denoted by 'r' and its direction is given by the signs positive and negative.
View full question & answer
Question 343 Marks
Name the graphic method of measuring dispersion. Write its three demerits.
Answer
The graphic method of measuring dispersion is called “Scatter diagram”. Its three demerits are:
  1. It does not indicate the numerical value of correlation as it is a non-mathematical method.
  2. It provides only a broad and rough idea of the correlation between the two variables.
  3. In case of more than two variables, it is not possible to draw a scatter diagram.
View full question & answer
Question 353 Marks
Give the disadvantages of Karl Pearson's coefficient of correlation.
Answer
The disadvantages of Karl Pearson's coefficient of correlation are:
  1. The value of coefficient is affected by extreme items.
  2. The calculation process consumes a lot of time.
  3. Correlation coefficient needs very careful interpretation, otherwise it may be misinterpreted.
View full question & answer
Question 363 Marks
What is Probable error? What is its utility?
Answer
It is used to help in the determination of the Karl Pearson's coefficient of correlation'r'. Due to this' r' is corrected to a great extent but note that 'r' depends on the random sampling and its conditions. it is given by$\text{P.E}=0.6745\bigg[\frac{1-\text{r}^2}{\sqrt{\text{n}}}\bigg]$If the value of r is less than P. E., then there is no evidence of correlation i.e. r is not significant If r is more than 6 times the P. E. 'r' is practically certain .i.e. significant. By adding or subtracting P. E. to 'r' , we get the upper and Lower limits within which'r' of the population can be expected to lie. $\text{symbolically}=\text{e = r}\pm\text{P.E}$ r = Correlation (coefficient ) of the population.
View full question & answer
Question 373 Marks
Mention the mathematical properties of correlation.
Answer
Mathematical properties of correlation are as follows:
  1. The correlation coefficient is symmetrical with respect to X and Y i.e. $^\gamma\text{XY}=\ ^\gamma\text{YX}$
  2. The correlation coefficient is independent of origin and unit of measurement i.e. $^\gamma\text{XY}=\ ^\gamma\text{UV}.$
  3. The correlation coefficient lies between - 1 and 1. i.e. $-1\leq\gamma\leq+1.$
View full question & answer
Question 383 Marks
Discuss importance and utility of correlation.
Answer
The study of correlation is of great significance because of reasons given below:
  1. To understand relationship between two or more variables: Correlation is very helpful when we want to study relationship between two or more variables.
  2. To find dependence: Correlation also helps in finding if one variable is dependent on other or not.
  3. Provides base for Regression Analysis: When two variables are correlated then the value of one variable can be estimated given the value of another variable using regression equations.
  4. Helps in decision making: It helps in taking important decisions to a business man, government and sociologists.
View full question & answer
Question 393 Marks
A scatter diagram is drawn by Avantika to assess the degree of correlation between price and quantity demanded. On plotting the points, she observes that all the points lie on the same downward sloping line and concludes that both the variables exhibit perfect positive correlation. Is she correct? Give reasons for your answer.
Answer
No, Avantika is not correct. Points on a downward sloping straight line depict perfect negative correlation.
View full question & answer
Question 403 Marks
If the points in a scatter diagram tend to cluster in a straight line which makes an angle of 30° with the X-axis, what would you say about the strength of association between X and Y?
Answer
If the points in a scatter diagram tend to cluster in a straight line which makes an angle of 30° with the X-axis, it means that the change in the value of Y is less proportionate than the change in the value of x. Thus, the strength of association between X and Y is moderate.
View full question & answer
Question 413 Marks
Define the variables of the given formula, $\text{r}=\frac{\sum\text{xy}}{\text{n}.\sigma_\text{x}.\sigma_\text{y}}$
Answer
the given formula, r = Coefficient of correlation$\sum\text{xy}$ = Sum of products of deviations of X from $\overline{\text{X}}$ and of Y from $\overline{\text{Y}}$
n = Number of pairs of items$\sigma_\text{x}$ = Standard deviation of X
$\sigma_\text{y}$= Standard deviation of Y.
View full question & answer
Question 423 Marks
Calculate the coefficient of correlation from the following data:$\Sigma\text{xy}=4880,\sigma_\text{x}=28.70\sigma_\text{y}=18.02,\text{n}=10$
Answer
Given that,$\Sigma\text{xy}=4880,\sigma_\text{x}=28.70\sigma_\text{y}=18.02,\text{n}=10$
$\text{r}=\frac{\Sigma\text{xy}}{\text{n}.\sigma_\text{x}.\sigma_\text{y}}=\frac{4880}{10\times28.70\times18.02}$
$=\frac{4880}{5171.74}=0.94$
View full question & answer
Question 433 Marks
Draw a scatter diagram of the following data and interpret to find the nature of correlation.
X
2
3
5
6
8
9
Y
6
5
7
8
12
11
Answer
The pair of points are (2, 6), (3, 5), (5, 7), (6, 8), (8, 12) and (9, 11). Now, we plot the points on a graph paper, which is shown below:
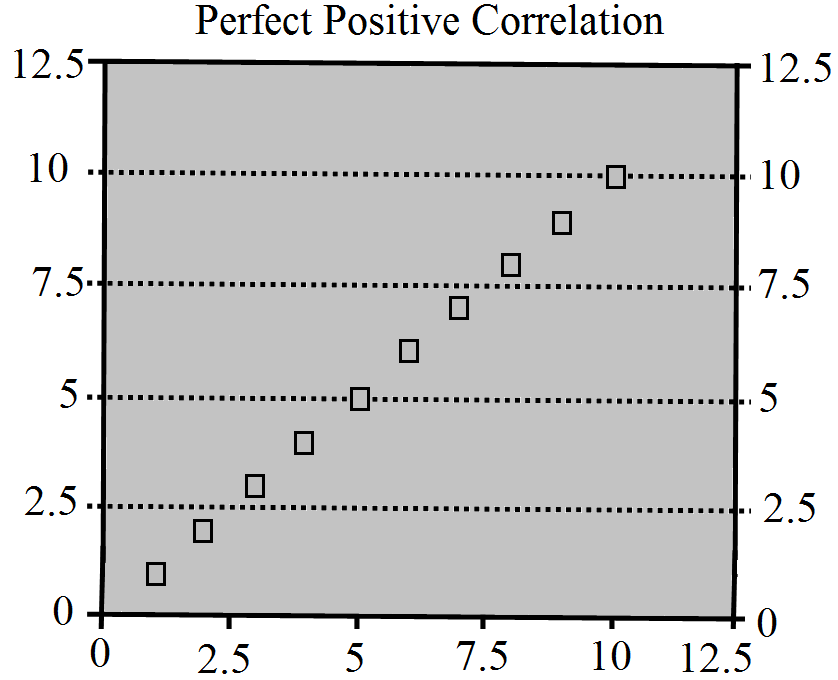
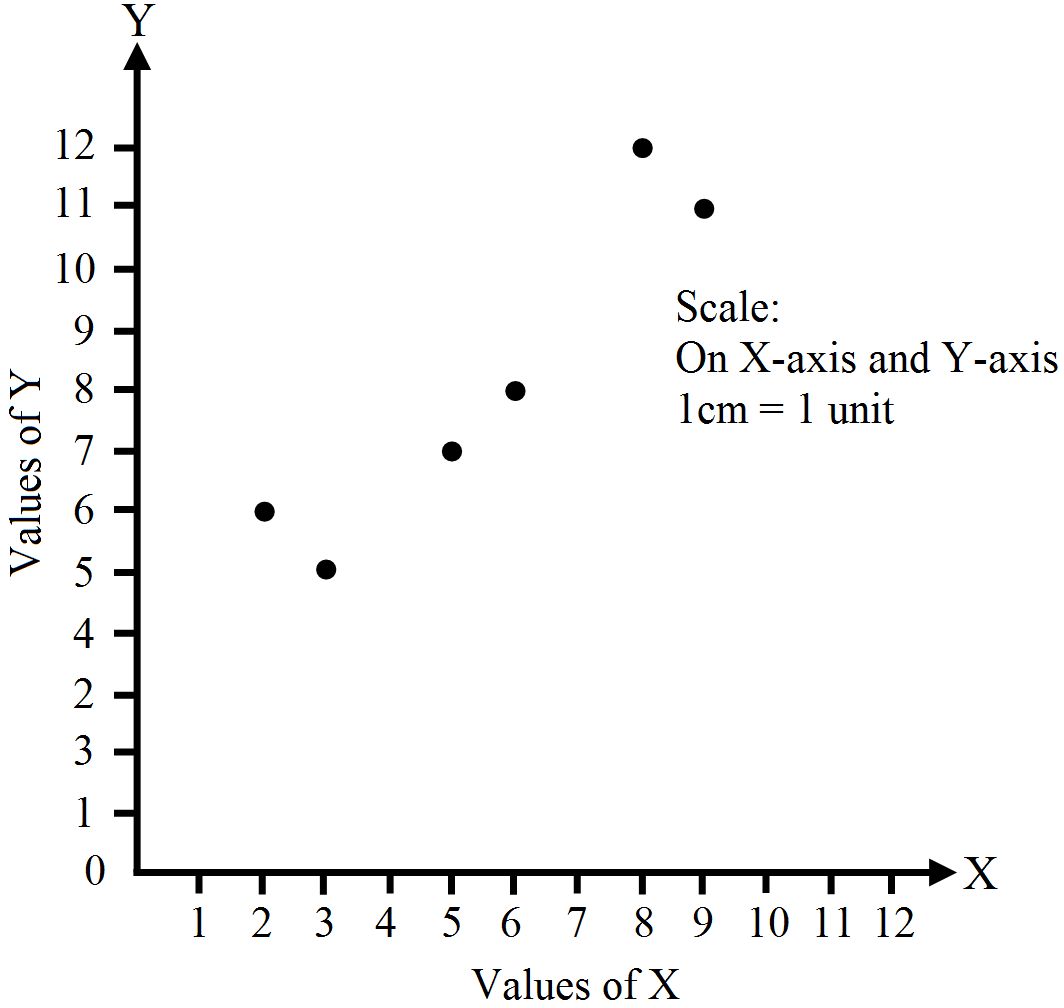
The diagram indicates that there is high degree of positive correlation because the plotted points are near to each other and the trend of the points is upward.
View full question & answer
3 Marks Question - Economics STD 11 Commerce Questions - Vidyadip