Question
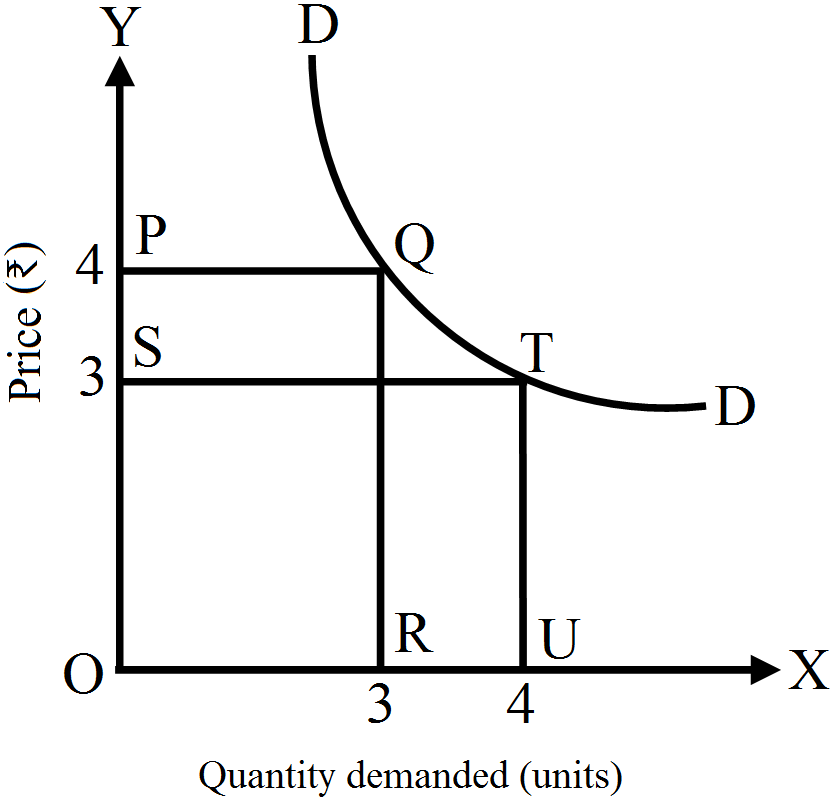
When does a demand curve take the shape of a rectangular hyperbola?
Generate a complete, print-ready paper with questions like this in minutes — across 16+ boards, with answer keys.
OR
Explain with the help of a diagram and using Saving = Investment approach the determination of equilibrium output and income level in an economy. What happens when the economy is not in equilibrium and saving exceeds investment?