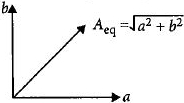
When two displacements represented by $y_1 = asin\left( \omega t \right)$ and $y_2 = bcos\left(\omega t \right)$ are superimposed the motion is
AIPMT 2015, Medium


Download our appand get started for free
Experience the future of education. Simply download our apps or reach out to us for more information. Let's shape the future of learning together!No signup needed.*
Similar Questions
- 1For a simple pendulum, a graph is plotted between its kinetic energy $(KE)$ and potential energy $(PE)$ against its displacement $d.$ Which one of the following represents these correctly ? (graphs are schematic and not drawn to scale)View Solution
- 2A particle is executing Simple Harmonic Motion $(SHM)$. The ratio of potential energy and kinetic energy of the particle when its displacement is half of its amplitude will beView Solution
- 3A simple pendulum hanging from the ceiling of a stationary lift has a time period $T_1$. When the lift moves downward with constant velocity, the time period is $T_2$, thenView Solution
- 4A body is executing $S.H.M.$ When its displacement from the mean position is $4\, cm$ and $5\, cm$, the corresponding velocity of the body is $10 \,cm/sec$ and $8\, cm/sec$. Then the time period of the body isView Solution
- 5A particle executes simple harmonic motion and is located at $x = a, b$ and $c$ at times $t_0, 2t_0$ and $3t_0$ respectively. The frequency of the oscillation isView Solution
- 6Kinetic energy of a particle executing simple harmonic motion in straight line is $pv^2$ and potential energy is $qx^2$, where $v$ is speed at distance $x$ from the mean position. It time period is given by the expressionView Solution
- 7View SolutionThe velocity of simple pendulum is maximum at
- 8$m x^{2}-b x+k=0$View Solution
Find time after which to the energy will become half of initial maximum value in damped force oscillation.
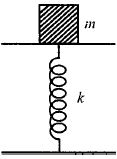
- 9A mass $m = 1.0\,kg$ is put on a flat pan attached to a vertical spring fixed on the ground. The mass of the spring and the pan is negligible. When pressed slightly and released, the mass executes simple harmonic motion. The spring constant is $500\,N/m.$ What is the amplitude $A$ of the motion, so that the mass $m$ tends to get detached from the pan ? (Take $g = 10\,m/s^2$ ). The spring is stiff enough so that it does not get distorted during the motion.View Solution
- 10A $S.H.M.$ is represented by $x = 5\sqrt 2 (\sin 2\pi t + \cos 2\pi t).$ The amplitude of the $S.H.M.$ is .... $cm$View Solution