MCQ
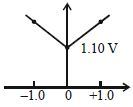
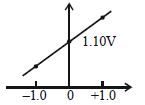
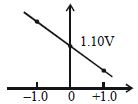
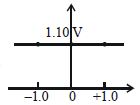
Which graph correct correlates $E_{cell}$ as a function of concentrations for the cell (for different values of $M$ and $M'$) :-

$Zn(s) + Cu^{2+}(M) \to Zn^{2+}(M') + Cu(s);$    $E^o _{cell} = 1.10\,V$

$X$-axis :$log_{10}$ $\frac{{[Z{n^{2 + }}]}}{{[C{u^{2 + }}]}}$,  $Y$ -axis : $E_{cell}$

  • A


  • C

  • D

Answer

Correct option: B.

b
${{\text{E}}_{\text{cell }}}=\text{E}_{\text{cell }}^{0}-\frac{0.059}{2}\log \frac{\left[ \text{Z}{{\text{n}}^{+2}} \right]}{\left[ \text{C}{{\text{u}}^{+2}} \right]}$

Need a full question paper?

Generate a complete, print-ready paper with questions like this in minutes — across 16+ boards, with answer keys.

Start Generating Free