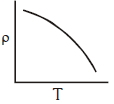
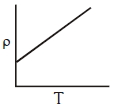
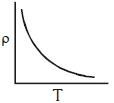
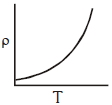
Which of the following graph represents the variation of resistivity ( $\rho$ ) with temperature $(T)$ for copper $?$
- A
- B
- C
- D
NEET 2020, Medium


Download our appand get started for free
Experience the future of education. Simply download our apps or reach out to us for more information. Let's shape the future of learning together!No signup needed.*
Similar Questions
- 1A potentiometer has uniform potential gradient. The specific resistance of the material of the potentiometer wire is $10^{-7} \, ohm-meter$ and the current passing through it is $0.1\, ampere$; cross-section of the wire is $10^{-6}\, m^2$. The potential gradient along the potentiometer wire isView Solution
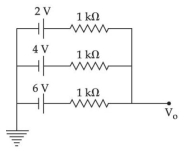
- 2In the given figure, the value of $V_{0}$ will be $.....V$.View Solution
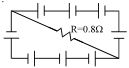
- 3$\mathrm{A}$ circuit is comprised of eight identical batteries and a resistor $R = 0.8\,\Omega$ . Each battery has an $\mathrm{emf}$ of $1.0\, V$ and internal resistance of $0.2\,\Omega$ . The voltage difference across any of the battery is ............. $V$View Solution
- 4The voltage of clouds is $4 \times 10^6\,volt$ with respect to round. In a lighteing strike lasting $100\,m\,sec$, a charge of $4\,coulombs$ is delivered to the ground. The power of lightening strike isView Solution
- 5View SolutionThe colour sequence in a carbon resistor is red, brown, orange and silver. The resistance of the resistor is
- 6View SolutionThe reciprocal of resistance is
- 7View SolutionAccording to Joule's law, if the potential difference across a conductor having a material of specific resistance remains constant, then the heat produced in the conductor is directly proportional to
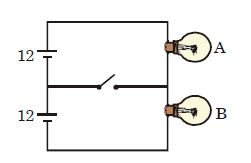
- 8Two light bulbs in the circuit have rating $A\,[24\ V, 48\,W]$ and $B\,[24\ V, 36\,W]$ as shown.View Solution
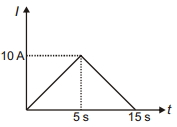
- 9Current $l$ versus time $t$ graph through a conductor is shown in the figure. Average current through the conductor in the interval $0$ to $15 \,s$ is ............ $A$View Solution
- 10A cell of e.m.f. $E$ is connected with an external resistance $R$, then p.d. across cell is $V$. The internal resistance of cell will beView Solution