Question
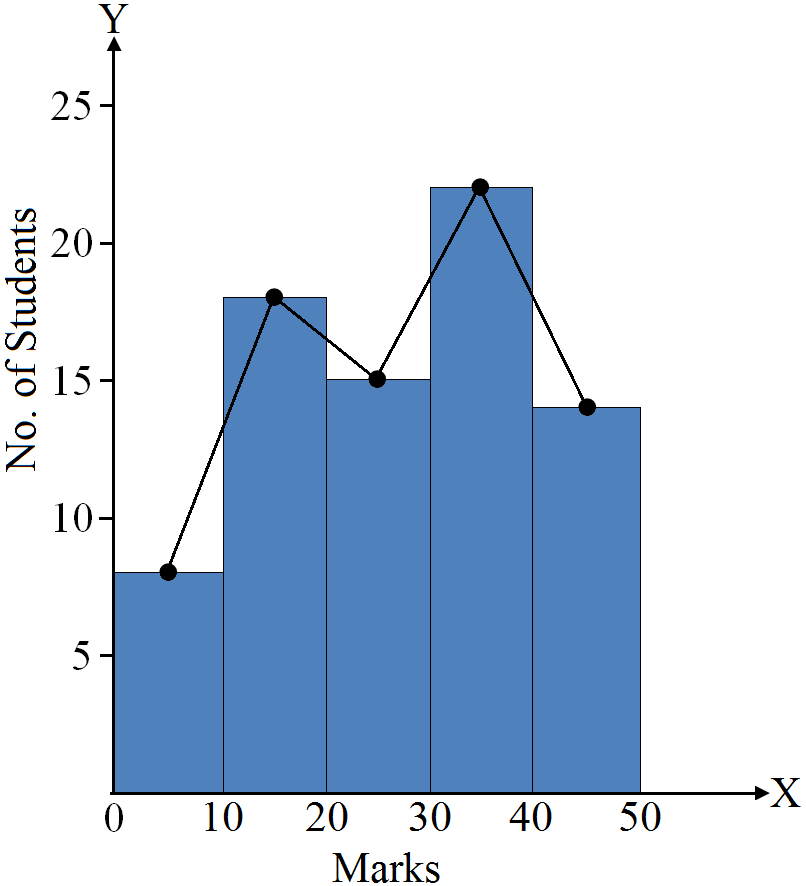
With the given data below, draw a histogram and a frequency polygon:
|
Marks
|
0-10
|
10-20
|
20-30
|
30-40
|
40-50
|
|
No. of Students
|
8
|
18
|
15
|
22
|
14
|