Question
With the help of a diagram explain the effect of “decrease” in demand of a commodity on its equilibrium price and quantity.
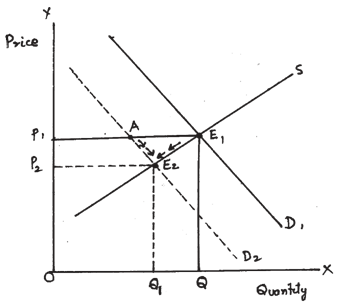 Decrease in demand means less demand at the same price. This leads to shift of demand curve to the left from $D_1$ to $D_2$.
Generate a complete, print-ready paper with questions like this in minutes — across 16+ boards, with answer keys.
|
Output
(Units)
|
Total Revenue
(₹)
|
Total Cost
(₹)
|
| 1 | 7 | 8 |
| 2 | 14 | 15 |
| 3 | 21 | 21 |
| 4 | 28 | 28 |
| 5 | 35 | 36 |