Question
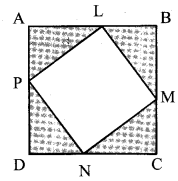
Without using a protractor, can you verify that every angle of the vacant quadrilateral in the adjacent figure is a right angle ?

Answer


Image
In the square ABCD the shaded triangles are right-angled and are the same.
In ∆LBM,
m∠BLM + m∠BML + m∠LBM = 180° …. (Sum of the measures of the angles of a triangles is 180° )
∴ m∠BLM + m∠BML + 90° = 180°
∴ m∠BLM + m∠BML = 90° …. (i)
Now, ∆LBM and ∆LAP are same.
∴ m∠BML = m∠ALP …. (ii)
∴ m∠BLM + m∠ALP = 90° …. IFrom (i) and (ii)l
Now, m∠ALP + m∠PLM + m∠BLM = 180° …. (The measure of a straight angle is 180°)
∴ m∠ALP + m∠BLM + m∠PLM = 180°
∴ 90° + m∠PLM = 180°
∴ m∠PLM = 180°- 90° = 90°
∴ m∠PLM is a right angle.
Similarly, we can prove that the other angles of the vacant quadrilateral are right angles.

Need a full question paper?

Generate a complete, print-ready paper with questions like this in minutes — across 16+ boards, with answer keys.

Start Generating Free

Similar questions

In a "magic square", the sum of the numbers in each row, in each column and along the diagonal is the same. Is this a magic square?
$\frac{4}{11}$ $\frac{9}{11}$ $\frac{2}{11}$
$\frac{3}{11}$ $\frac{5}{11}$ $\frac{7}{11}$
$\frac{8}{11}$ $\frac{1}{11}$ $\frac{6}{11}$
The following data gives the amount of loans (in crores of rupees) disbursed by a bank during some years:
Year
1992
1993
1994
1995
1996
Loan (in crores of rupees)
28
33
55
55
80
  1. Represent the above data with the help of a bar graph.
  2. With the help of the bar graph, indicate the year in which amount of loan is not increased Over that of the preceding year.
The production of saleable steel in some of the steel plants of our country during 1999 is given below:
Plant
Bhilai
Durgapur
Rourkela
Bokaro
Production(in thousand tonnes)
160
80
200
150
Construct a bar graph to represent the above data on a graph paper by using the scale 1 big division=20 thousand tonnes.
Draw $\triangle\text{DEF}$ such that DE= DF= 4cm and EF = 6cm. Measure $\angle\text{E}$ and $\angle\text{F}.$
Draw the pairs of angles as described below. If that is not possible, say why.
i. Complementary angles that are not adjacent.
ii. Angles in a linear pair which are not supplementary.
iii. Complementary angles that do not form a linear pair.
iv. Adjacent angles which are not in linear pair.
v. Angles which are neither complementary nor adjacent.
vi. Angles in a linear pair which are complementary.
The following data shows the average age of men in various countries in a certain year:
Country
India
Nepal
China
Pakistan
U.K
U.S.A
Average age(in years)
55
52
60
50
70
75
Represent the above information by a bar graph.
The following table shows the market position of different brands of soaps. Draw a bar graph to represent this data.
Brand
A
B
C
D
Other
Percentage of buyers
45
25
15
10
5
In $\triangle \text{ABC},$ if $3\angle \text{A}=4\angle \text{B}=6\angle \text{C},$ calculate the angles.
The following table shows the imports (in thousand crore rupees) made by India over the last five years. Draw a bar graph to represent this data.
Year
2001-02
2002-03
2003-04
2004-05
2005-06
Imports (in thousand crore rupees)
148
176
204
232
180
Construct a $\triangle\text{PQR}$ in which QR = 6cm, PQ = 4.4cm and PR = 5.3cm. Draw the bisector of $\angle\text{P.}$