Question
Write a python program to create the list numeric values and sort the list using Bubble sort technique.
Get the step-by-step solution for this question inside the Vidyadip app.
Get the answer in the appGenerate a complete, print-ready paper with questions like this in minutes — across 16+ boards, with answer keys.
https://data.gov.in/catalog/statistical-hand-book-2009-education?filters%5Bfield_catalog_reference%5D=6690578& format=json&offset=6&limit=6&sort%5Bcreated%5D=desc
Schools for Professional Education 2007-08 : SHB 2009
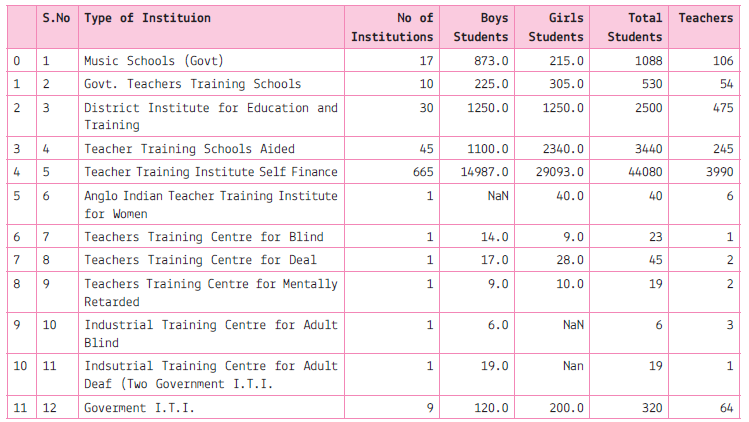
(i) Write a python / statement to read the data frame.
(ii) Write a python code to plot the pie chart of all the institutions which have more than hundred teachers. Also display the values of portion.
(iii) Write a python code to plot the horizontal bar chart to plot the Type of institution and Total students.
(iv) Write a python code to plot the scatter diagram boys vs girls students.
(v) Write a python code to plot the histogram for no. of institution.
1. Insert
2. Delete
3. Update
4. Display all
5. Search a Records
6. Create table
Answer the following question the basis of given dataframe:
| Itemno | ItemName | Color | Price | |
| 0 | 1 | Ball Pen | Black | 15.0 |
| 1 | 2 | Pencil | Blue | 5.5 |
| 2 | 3 | Ball Pen | Green | 10.5 |
| 3 | 4 | Gel Pen | Green | 11.0 |
| 4 | 5 | Notenook | Red | 15.5 |
| 5 | 6 | Ball Pen | Green | 11.5 |
| 6 | 7 | Highlighter | Blue | 8.5 |
| 7 | 8 | Gel Pen | Red | 12.5 |
| 8 | 9 | P Marker | Blue | 5.6 |
| 9 | 10 | Ball Pen | Green | 11.5 |
(i) To set the index to column Item Name.
(ii) To print the pivoting the data based on Item name as index, column as color and values as price.
(iii) To print the data as row index Itemname and columns index as color. Fill NaN as blank
(iv) To create another alias df3 and store the result of question 2.
(v) To add a new column QTY.
(vi) To print the mean priceod of all Item name and color wise.
(vii) To print the mean of the price, Item name and color margin wise.
(viii) To print the mean of the price, Item name and color wise with margins as Total.
(ix) To display the sorted data in ascending order according to the price
(x) To display the sorted data in descending order according to the price
(xi) To sort the data index wise.
(xii) To print the median.
(xiii) To print the maximum values column wise.
(xiv) To print the sum of the price.
(xv) To print the maximum of each column
(xvi) To print the first quantile of the price.
(xvii) To print the first quantile of Item no
(xviii) To print the first quartile, second quartile and third quartile. of Item no.
(xix) To print all the descriptive statistics.
As a network consultant, you have to suggest the best network related solutions for their issues/
problems raised in (a) to (d) keeping in mind the distances between various locations and other given parameters.
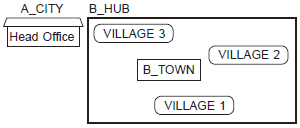
Shortest distances between various locations:
| VILLAGE 1 to B_TOWN | 2 KM |
| VILLAGE 2 to B_TOWN | 1.0 KM |
| VILLAGE 3 to B_TOWN | 1.5 KM |
| VILLAGE 1 to VILLAGE 2 | 3.5 KM |
| VILLAGE 1 to VILLAGE 3 | 4.5 KM |
| VILLAGE 2 to VILLAGE 3 | 2.5 KM |
| A_CITY Head Office to B_HUB | 25 KM |
Number of Computers installed at various locations are as follows:
| B_TOWN | 120 |
| VILLAGE 1 | 15 |
| VILLAGE 2 | 10 |
| VILLAGE 3 | 15 |
| A_CITY OFFICE | 6 |
Note:
• In Villages, there are community centers, in which one room has been given as training center to this organization to install computers.
• The organization has got financial support from the government and top IT companies.
(a) Suggest the most appropriate location of the SERVER in the B_HUB (out of the 4 locations), to get the best and effective connectivity. Justify your answer.
(b) Suggest the best wired medium and draw the cable layout (location to location) to efficiently connect various locations within the B_HUB.
(c) Which hardware device will you suggest to connect all the computers within each location of B_HUB?
(d) Which service/protocol will be most helpful to conduct live interactions of Experts from Head Office and people at all locations of B_HUB?