Question
Write a python program using method to create the list of numeric values and search the number in the list using Binary Search Technique.
Get the step-by-step solution for this question inside the Vidyadip app.
Get the answer in the appGenerate a complete, print-ready paper with questions like this in minutes — across 16+ boards, with answer keys.
You as a network expert have to suggest the best network related solutions for their problems raised in (a) to (d), keeping in mind the distances between the buildings and other given parameters.
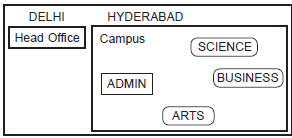
Shortest Distances between various buildings:
| ADMIN to SCIENCE | 65 M |
| ADMIN to BUSINESS | 100 m |
| ADMIN to ARTS | 60 M |
| SCIENCE to BUSINESS | 75 M |
| SCIENCE to ARTS | 60 M |
| BUSINESS to ARTS | 50 M |
| DELHI Head Office to HYDERABAD Campus | 1600 KM |
Number of Computers installed at various building are as follows:
| ADMIN | 100 |
| SCIENCE | 85 |
| BUSINESS | 40 |
| ARTS | 12 |
| DELHI Head Office | 20 |
(a) Suggest the most appropriate location of the server inside the HYDERABAD campus (out of the 4 buildings), to get the best connectivity for maximum no. of computers. Justify your answer.
(b) Suggest and draw the cable layout to efficiently connect various buildings ‘within the HYDERABAD campus for connecting the computers.
(c) Which hardware device will you suggest to be procured by the company to be installed to protect and control the internet uses within the campus?
(d) Which of the following will you suggest to establish the online face-to-face communication between the people in the Admin Office of HYDERABAD campus and DELHI Head Office?
(a) E-mail (b) Text Chat (c) Video Conferencing (d) Cable TV
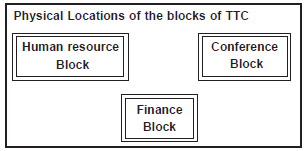
Block to Block distances (in Mtrs.)
| FROM | To | Distance |
| Human resource | Conference | 110 |
| Human resource | Finance | 40 |
| Conference | Finance | 80 |
Number of computers in each of the blocks/Center is as follows:
| Human resource | 25 |
| Finance | 120 |
| Conference | 90 |
(a) What will be the most appropriate block, where TTC should plan to install the server?
(b) Draw a block to block cable layout to connect all the buildings in the most appropriate manner for efficient communication.
(c) What will be the best possible connectivity out of the following, you will suggest to connect the new setup of offices in Bangalore with its London based office?
Satellite Link, Infrared, Ethernet cable
(d) Which of the following devices will be suggested by you to connect each computer in each of the buildings.
Switch, modem, Gateway
Write a program to sort the (name, age, height) tuples by ascending order where name is string, age and height are numbers. The tuples are input by the user. The sort criteria is:
1: Sort based on name;
2: Then sort based on age;
3: Then sort by score.
The priority is that name >age >score.
If the following tuples are given as input to the
program:
ram,19,20
Shyam,15,67
Raju,13,90
Rakesh,17,78
Then, the output of the program should be:
[('Raju', '13', '90'), ('Rakesh', '17', '78'), ('Shyam', '15', '67'), ('ram', '19', '20')]

| class | order | max_speed | |
| falcon | bird | Falconiformes | 389.0 |
| parrot | bird | Psittaciformes | 24.0 |
| lion | mammal | Carnivora | 80.2 |
| monkey | mammal | Primates | NaN |
| leopard | mammal | Carnivora | 58.0 |
(i) To print the class wise sum.
(ii) To print the order wise mean
(iii) To sort the index.
(iv) To print the sum of the class wise along with orders columns indexing.
(v) To count the records.
![]()
data name : Percentage of Schools with Computers from 2013-14 to 2015-16
Screen shot of the data:
Assuming that we have saved the file with name: "computer_data" in python default folder.
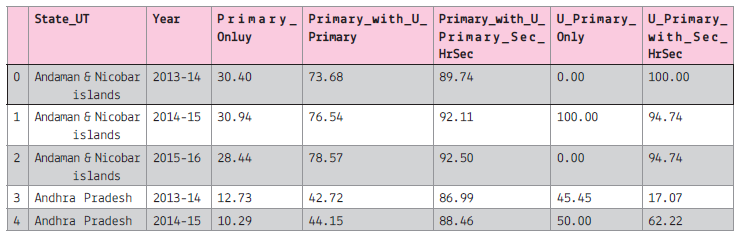
Assuming that all the required libraries are imported once:
![]()
(i) To create the data frame of the above file.
(ii) To display all the column names of the data frame.
(iii) To plot the line graph for the first 5 record of the Primary Only column on y-axis and 'State_UT' on x-axis.
The line colour should be red and marker as 'x'. The graph will display only 2013-14
(iv) To display the histogram of the 2013-14, primary_only column.
(v) To display bar graph of the last 7 record of the year 2013-14 use the title and required label. Also write the statement to create the data frame.
(vi) To display the pie chart of the first 10 records of the 2013-14. Also create the data frame.
(vii) To display the boxplot for the Sec with higher secondary and All India data.
(viii) To display the scatter diagram of the 2014-15