Question
Answer the following question based on the given dataset download from data.gov.in:

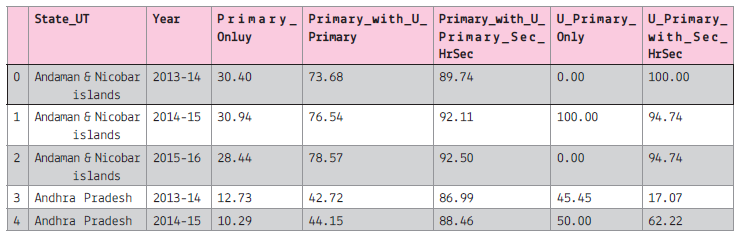
data name : Percentage of Schools with Computers from 2013-14 to 2015-16

Screen shot of the data:

Assuming that we have saved the file with name: "computer_data" in python default folder.

Assuming that all the required libraries are imported once:

(i) To create the data frame of the above file.

(ii) To display all the column names of the data frame.

(iii) To plot the line graph for the first 5 record of the Primary Only column on y-axis and 'State_UT' on x-axis.

The line colour should be red and marker as 'x'. The graph will display only 2013-14

(iv) To display the histogram of the 2013-14, primary_only column.

(v) To display bar graph of the last 7 record of the year 2013-14 use the title and required label. Also write the statement to create the data frame.

(vi) To display the pie chart of the first 10 records of the 2013-14. Also create the data frame.

(vii) To display the boxplot for the Sec with higher secondary and All India data.

(viii) To display the scatter diagram of the 2014-15

Answer

Get the step-by-step solution for this question inside the Vidyadip app.

Get the answer in the app

Need a full question paper?

Generate a complete, print-ready paper with questions like this in minutes — across 16+ boards, with answer keys.

Start Generating Free

Similar questions

WAP to generate n lines of the following pattern on the computer screen:
Write a python program using function to accept a list as parameter and multiply all the odd elements by 5. [This program will also demonstrate by reference concept]

Write a program that reads a line and a substring. It should then display the number of the occurrence of the given substring in the line.

Write a script to create two lists of 5 floating point values each and then
(a) Sort the first list using sort() method and display it without using any loop
(b) Reverse the second list using reverse() method and display it without using any loop
(c) Append the second list to the first list using extend() method
(d) Delete all the elements from the second list using clear() method
(e) Display the first list (after performing the above operations)
(f) Input an integer from the user and find how many times does it exist in the first list using count() method

Write a function readall() the record from the binary file “student” and display all the records
WAP to find the sum of first n terms of the following series:
$1+ x +\frac{x^2}{2}+\frac{x^3}{3}+\ldots$
Granuda Consultants are setting up a secured network for their office campus at Faridabad for their day to day office and web based activities. They are planning to have connectivity between 3 buildings and the head office situated in Kolkata. Answer the questions (a) to (d) after going through the building positions in the campus and other details, which are given below:

Distances between various buildings:

Building “RAVI” to Building “JAMUNA” 120m
Building “RAVI” to Building “GANGA” 50m
Building “GANGA” to Building “JAMUNA” 65m
Faridabad Campus to Head Office 1460km

Number of computers:

Building “RAVI” 25
Building “JAMUNA” 150
Building “GANGA” 51
Head Office 10

(a) Suggest the most suitable place (i.e. block) to house the server of this organization. Also give a reason to justify your suggested location.

(b) Suggest a cable layout of connections between the buildings inside the campus.

(c) Suggest the placement of the following devices with justification:

(i) Switch

(ii) Repeater

(d) The organization is planning to provide a high speed link with its head office situated in KOLKATA using a wired connection. Which of the following cable will be most suitable for this job?

(i) Optical Fiber

(ii) Co-axial cable

(iii) Ethernet cable

How to Delete Indices, Rows or Columns From a Pandas Data Frame?

Consider the following tables GAMES and PLAYER. Write SQL commands for the statements (a) to (d) and give outputs for SQL queries (e1) to (e4)

Relation: GAMES

GCode Game Name Number Prize Money Schedule Date
101 Carom Board 2 5000 23-Jan-2004
102 Badminton 2 12000 12-Dec-2003
103 Table Tennis 4 8000 14-Feb-2004
105 Chess 2 9000 01-Jan-2004
108 Lawn Tennis 4 25000 19-Mar-2004

Relation: PLAYER

PCode Name Gcode
1 Nabi Ahmad 101
2 Ravi Sahai 108
3 Jatin 101
4 Nazneen 103

(a) To display the name of all Games with their Gcodes

(b) To display details of those games which are having PrizeMoney more than 7000.

(c) To display the content of the GAMES table in ascending order of ScheduleDate.

(d) To display sum of PrizeMoney for each of the Number of participation groupings (as shown in column Number)

(e1) Select COUNT(DISTINCT Number) FROM GAMES;

(e2) Select MAX(ScheduleDate),MIN(ScheduleDate) FROM GAMES;

(e3) Select SUM(PrizeMoney) FROM GAMES;

(e4) Select DISTINCT Gcode FROM PLAYER;