Question
Write algorithm for Delete operation in Queue.
Get the step-by-step solution for this question inside the Vidyadip app.
Get the answer in the appGenerate a complete, print-ready paper with questions like this in minutes — across 16+ boards, with answer keys.
Write SQL commands for the following queries on the basis of Club relation given below:
Relation: Club
| Coach-ID | CoachName | Age | Sports | date_of_app | Pay | Sex |
| 1 | Kukreja | 35 | Karate | 27/03/1996 | 1000 | M |
| 2 | Ravina | 34 | Karate | 20/01/1998 | 1200 | F |
| 3 | Karan | 34 | Squash | 19/02/1998 | 2000 | M |
| 4 | Tarun | 33 | Basketball | 01/01/1998 | 1500 | M |
| 5 | Zubin | 36 | Swimming | 12/01/1998 | 750 | M |
| 6 | Ketaki | 36 | Swimming | 24/02/1998 | 800 | F |
| 7 | Ankita | 39 | Squash | 20/02/1998 | 2200 | F |
| 8 | Zareen | 37 | Karate | 22/02/1998 | 1100 | F |
| 9 | Kush | 41 | Swimming | 13/01/1998 | 900 | M |
| 10 | Shailya | 37 | Basketball | 19/02/1998 | 1700 | M |
(a) To show all information about the swimming coaches in the club.
(b) To list the names of all coaches with their date of appointment (date_of_app) in descending order.
(c) To display a report showing coach name, pay, age, and bonus (15% of pay) for all coaches.
(d) To insert a new row in the Club table with ANY relevant data:
(e) Give the output of the following SQL statements:
(i) Select COUNT(Distinct Sports) from Club;
(ii) Select Min(Age) from Club where SEX = “F ”;
![]()
data name : Percentage of Schools with Computers from 2013-14 to 2015-16
Screen shot of the data:
Assuming that we have saved the file with name: "computer_data" in python default folder.
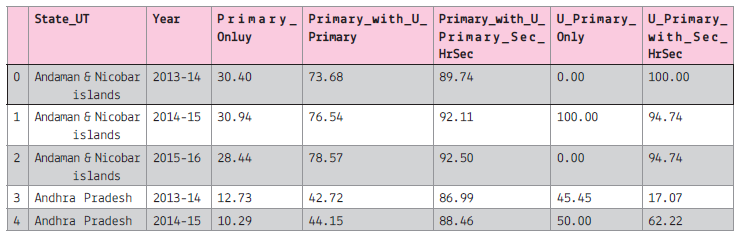
Assuming that all the required libraries are imported once:
![]()
(i) To create the data frame of the above file.
(ii) To display all the column names of the data frame.
(iii) To plot the line graph for the first 5 record of the Primary Only column on y-axis and 'State_UT' on x-axis.
The line colour should be red and marker as 'x'. The graph will display only 2013-14
(iv) To display the histogram of the 2013-14, primary_only column.
(v) To display bar graph of the last 7 record of the year 2013-14 use the title and required label. Also write the statement to create the data frame.
(vi) To display the pie chart of the first 10 records of the 2013-14. Also create the data frame.
(vii) To display the boxplot for the Sec with higher secondary and All India data.
(viii) To display the scatter diagram of the 2014-15