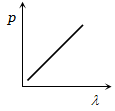
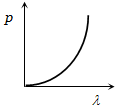
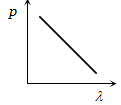
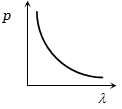
Which of the following figure represents the variation of particle momentum and the associated de-Broglie wavelength
|
(a)
|
(b)
|
(c)
|
(d)
|
463 questions across 1 question group — pick any mix to generate a Physics paper with step-by-step answer keys.
One sample from each question group in this chapter. Select any group above to see the full set with answer keys.
Which of the following figure represents the variation of particle momentum and the associated de-Broglie wavelength
|
(a)
|
(b)
|
(c)
|
(d)
|
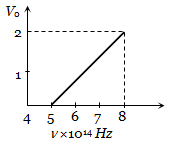
The stopping potential (![]() versus frequency (n) plot of a substance is shown in figure the threshold wave length is
versus frequency (n) plot of a substance is shown in figure the threshold wave length is
|
(a) 5 |
(b) 6000Å |
|
(c) 5000 Å |
(d) Can not be estimated from given data |
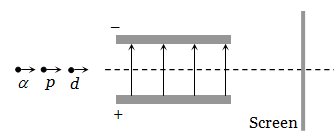
A proton, a deutron and an a-particle having the same momentum, enters a region of uniform electric field between the parallel plates of a capacitor. The electric field is perpendicular to the initial path of the particles. Then the ratio of deflections suffered by them is
|
(a) 1 : 2 : 8 |
(b) 1 : 2 : 4 |
(c) 1 : 1 : 2 |
(d) None of these |
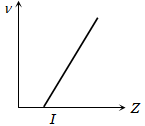
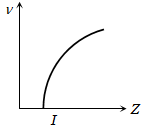
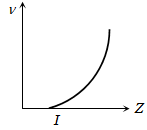
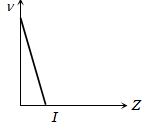
The graph that correctly represents the relation of frequency n of a particular characteristic X-ray with the atomic number Z of the material is
|
(a)
|
(b)
|
(c)
|
(d)
|
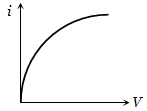
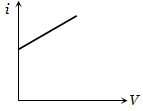
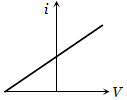
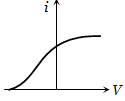
The curve between current (i) and potential difference (V) for a photo cell will be
|
(a)
|
(b)
|
(c)
|
(d)
|
Pick question groups from the list above, set marks and difficulty, and export a branded PDF with step-by-step answer keys. First 3 chapters free — no signup.