MCQ 511 Mark
Read the graph and answer the related questions:
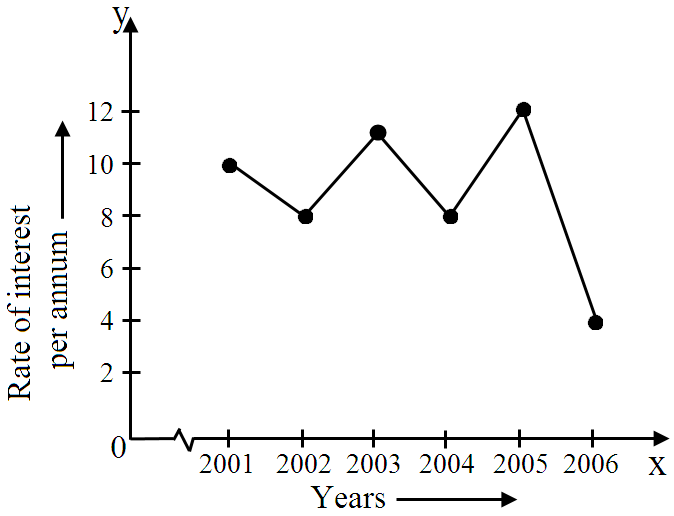
Rise in interest from $2004$ to $2005$ was. View full question & answer→MCQ 521 Mark
The points $(-3, 2)$ and $(2, -3)$ represent:
AnswerThe given statement the point is different points.
Because, both of the given points are not same points.
In the points $(3, 5),$
$i. 3 = x -$ coordinate
$ii. 5 = y-$ coordinate
In the points $(5, 3),$
$i. 5 = x-$ coordinate
$ii. 3 = y-$ coordinate
View full question & answer→MCQ 531 Mark
Read the graph and answer the related questions:
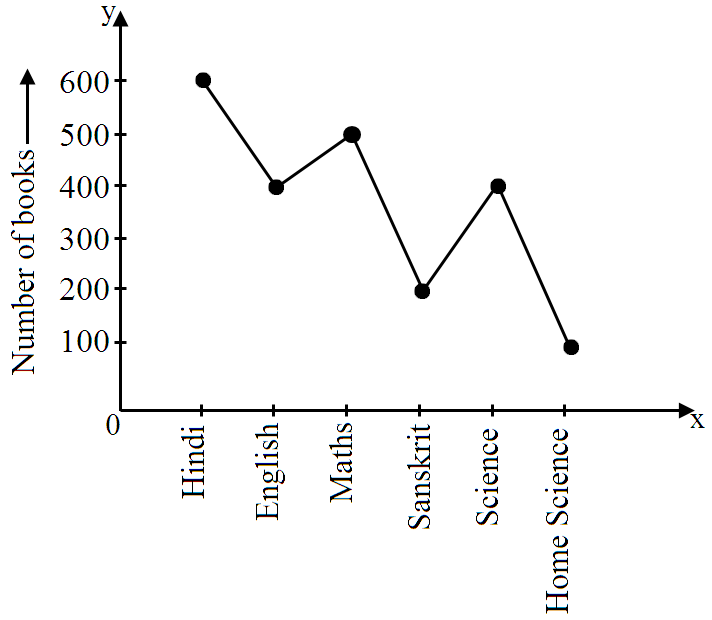
$500$ books are of which subject? View full question & answer→MCQ 541 Mark
The following graph shows the temperature forecast $\&$ the actual temperature for each day of a week. On the basis of the graph, answer the following questions.
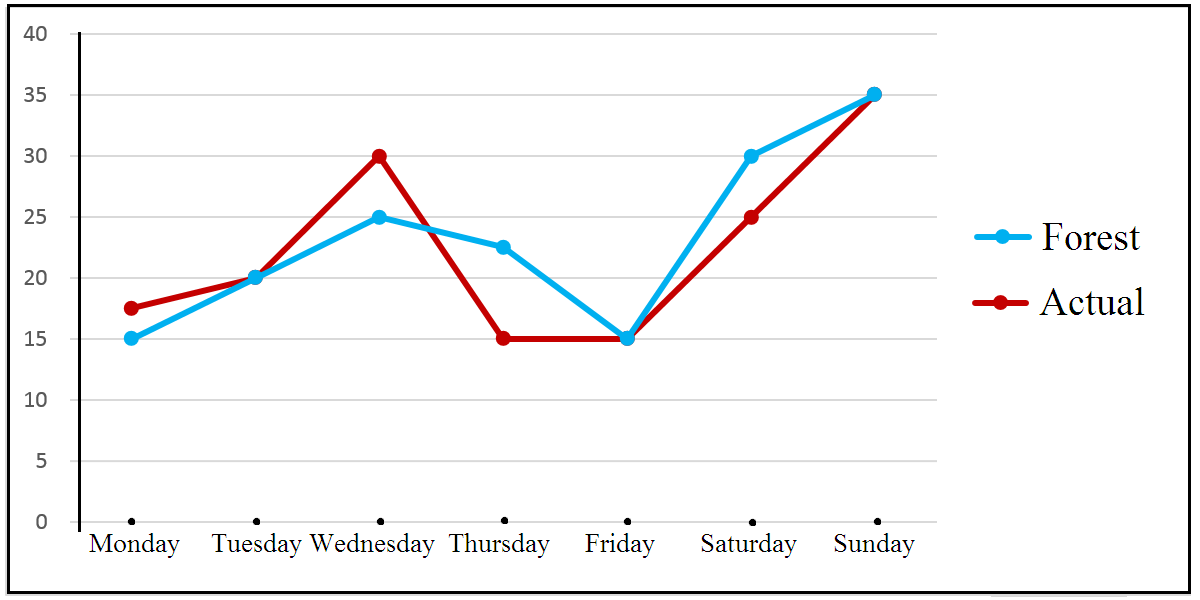
On which days did the actual temperature differ the most from the forecast temperature? View full question & answer→MCQ 551 Mark
On which axis does the point $(5, 0)$ lie?
AnswerCorrect option: C. $X-$axis
$X-$axis
View full question & answer→MCQ 561 Mark
Read the graph and answer the related questions:

How many students appeared in the year $2000?$ View full question & answer→MCQ 571 Mark
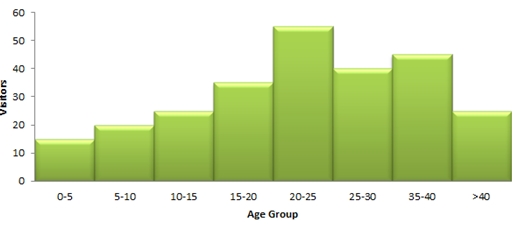
Observe the following histogram and answer the related questions:
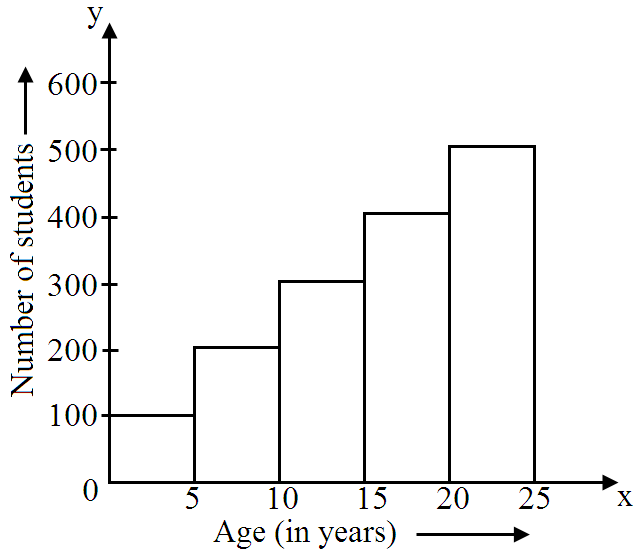
The sum of the number of students in the class intervals $10-15$ and $20-25$ is: Answer$10-15 \rightarrow 300$
$20-25 \rightarrow 500$
$300 + 500 = 800$
View full question & answer→MCQ 581 Mark
In which quadrant does the point $P (-5, -1)$ lie?
View full question & answer→MCQ 591 Mark
Observe the following circle-graph and answer the related questions:
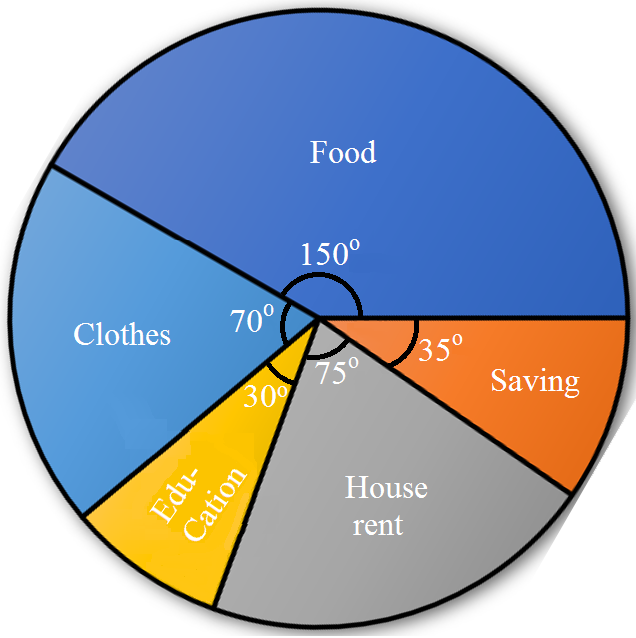
What is the difference of expenditures on clothes and education if the budget of the family is Rs. $10800?$ - ✓
Rs. $1200$
- B
Rs. $1000$
- C
Rs. $800$
- D
Rs. $1500$
AnswerCorrect option: A. Rs. $1200$
$70-30=40$
$\frac{40}{360}\times10800=1200$
View full question & answer→MCQ 601 Mark
The point $(-2, 5)$ is nearer to:
AnswerCorrect option: A. $X-$axis
$X-$axis
View full question & answer→MCQ 611 Mark
Data was collected on a student’s typing rate and graph was drawn as shown below. Approximately how many words had this student typed in $30$ seconds?
AnswerObserving the graph, we see that the graph intersects the line $x = 30$ just below the point $(30, 30)$, which is the intersection of the lines* $= 30$ and $y- 30.$
Since, the $X-$axis represents the time (in seconds) and the $Y-$axis represents the number of words typed, therefore we conclude that the students had typed approximately $28$ words In $30s.$
View full question & answer→MCQ 621 Mark
Read the graph and answer the related questions:
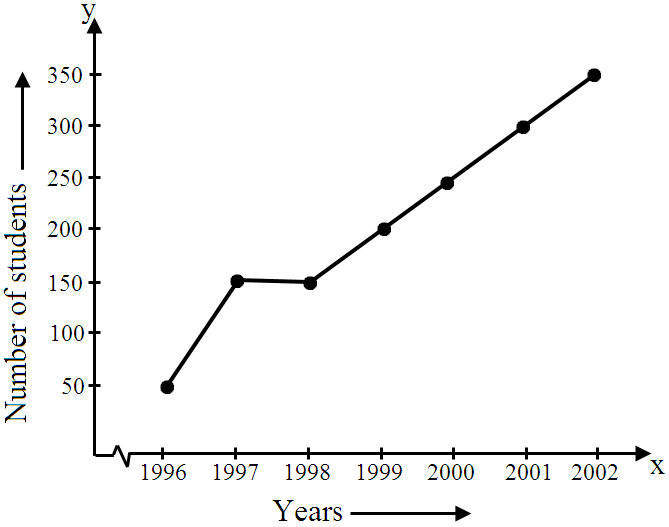
In which year did $50$ students appear? - A
$1998$
- B
$2001$
- C
$1997$
- ✓
$1996$
AnswerCorrect option: D. $1996$
$50 \rightarrow 1996$
View full question & answer→MCQ 631 Mark
The given line graph shows the growth rate of a kitten During which $2$ month period the kittens weight increased the most: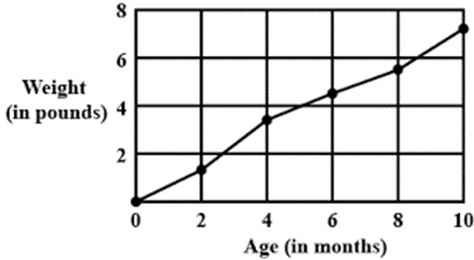
- A
$0$ to $2$ months
- ✓
$2$ to $4$ months
- C
$4$ to $6$ months
- D
$6$ to $8$ months
AnswerCorrect option: B. $2$ to $4$ months
The line graph shown is steepest from the period of $2$ months to $4$ months showing that the growth is maximum.
View full question & answer→MCQ 641 Mark
The point $(-2, -2)$ is:
AnswerCorrect option: D. Equidistant from $x-$axis and $y-$axis.
Equidistant from $x-$axis and $y-$axis.
View full question & answer→MCQ 651 Mark
Here is the list of temperature in $^\circ C$ for $10$ days. $-9, -11, 0, 5, 3, -5, 7, 1, 0, 3$ What is the range of the data'?
- A
$7^\circ C$
- ✓
$18^\circ C$
- C
$0^\circ C$
- D
$-11^\circ C$
AnswerCorrect option: B. $18^\circ C$
Range of data = Maximum temperature- Minimum temperature $= 7 - (-11) = 18$
View full question & answer→MCQ 661 Mark
In the given graph the coordinates of point $x$ are:
- A
$(0, 2)$
- B
$(2, 3)$
- ✓
$(3, 2)$
- D
$(3, 0)$
AnswerCorrect option: C. $(3, 2)$
The foot of the perpendicular drawn from the indicated point on $X-$axis is at a distance of $3$ units from the origin.
The $x-$coordinate of the point is $3.$
Again, the perpendicular drawn from the given point on $Y-$axis meets the $Y-$axis at a point which is at a distance of $2$ units from origin.
The $y-$coordinate of the point is $2.$
Hence, the coordinates of the point are $(3, 2).$
View full question & answer→MCQ 671 Mark
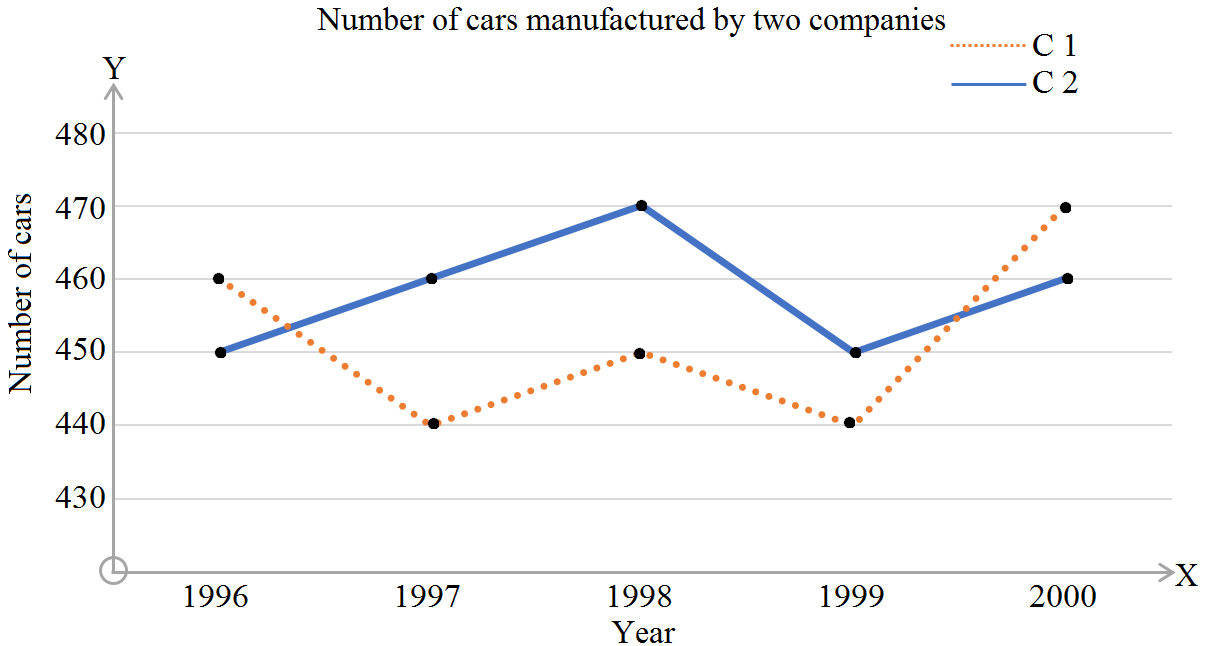
Refer the given graph and answer the following question: In which year, was the number of cars manufactured by both the companies the highest?
- A
$1997$
- B
$1998$
- C
$1999$
- ✓
$2000$
AnswerCorrect option: D. $2000$
For the year $1996$, total cars manufactured $= 450 + 460 = 910$
For the year $1997$, total cars manufactured $= 440 + 460 = 900$
For the year $1998$, total cars manufactured $= 450 + 470 = 920$
For the year $1999$, total cars manufactured $= 440 + 450 = 890$
For the year $2000$, total cars manufactured $= 460 + 470 = 930$
The highest is in the year $2000.$
View full question & answer→MCQ 681 Mark
Observe the following bar graph and answer the related questions:
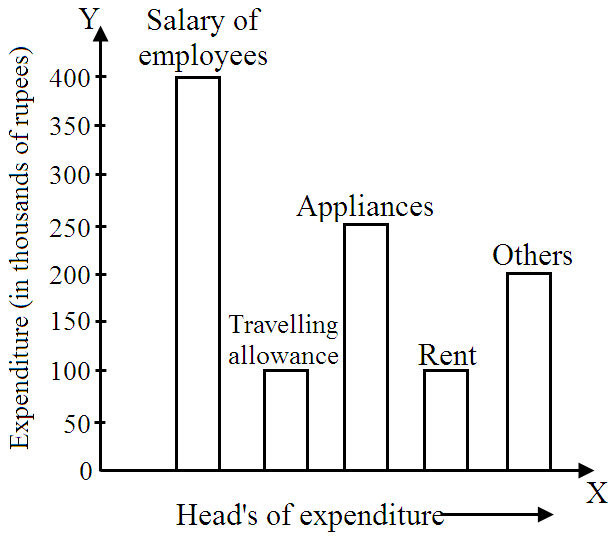
What is the sum of the expenditures (in thousands of rupees) on travelling allowance and rent?
MCQ 691 Mark
Read the graph and answer the related questions:
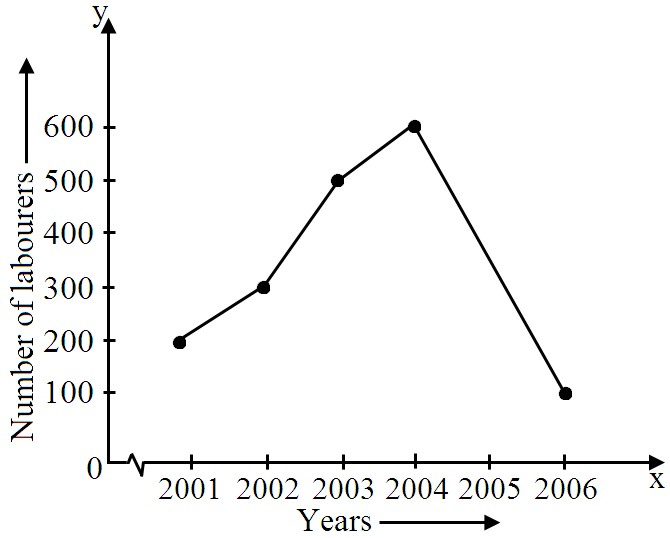
In which year was the number of labourers maximum?
- A
$2001$
- B
$2002$
- C
$2003$
- ✓
$2004$
AnswerCorrect option: D. $2004$
View full question & answer→MCQ 701 Mark
Observe the following velocity-time graph and answer the related questions:
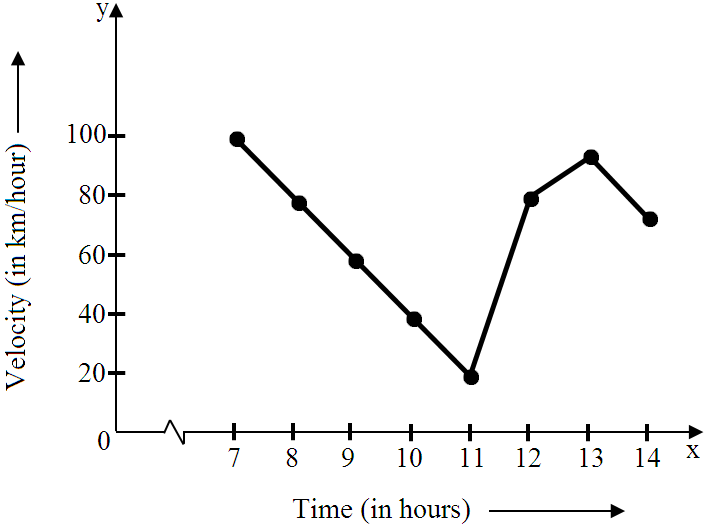
At what time is the velocity minimum?
Answer$11 \rightarrow 20$
View full question & answer→MCQ 711 Mark
Which is a two dimensional graph?
AnswerA histogram is a two dimensional graph. Shown in the figure above is a histogram.
View full question & answer→MCQ 721 Mark
Observe the following runs-over graph and answer the related questions:

$3$ runs are scored in which overs? - ✓
$II$ and $X$
- B
$I$ and $V$
- C
$VII$ and $VIII$
- D
$X$ and $XII$
AnswerCorrect option: A. $II$ and $X$
$II \rightarrow 3, X \rightarrow 3$
View full question & answer→MCQ 731 Mark
On which axis does the point $(-1, 0)$ lie?
AnswerCorrect option: A. $X-$axis
$X-$axis
View full question & answer→MCQ 741 Mark
In the given graph the letter that indicates the point $(0, 3)$ is:
AnswerThe letter that indicates the point $(0, 3)$ is $R$ as it lies on the $Y-$axis at a distance of $3$ units from the origin.
The coordinates of the point $P$ and Sare $(3, 0)$ and $(3, 3)$, respectively.
View full question & answer→MCQ 751 Mark
The point $(-5, 6)$ is nearer it:
AnswerCorrect option: B. $Y-$oxis
Given point is $(-5, 6) x$ coordinate $= -5$ and $y$ coordinate $= 6$ hence, distance of the point from $x$ axis $= 6$ units and distance of the point from $y$ axis $= 5$ units.
Thus the point is nearer to $y$ axis.
View full question & answer→MCQ 761 Mark
Which of the following are types of graph which include bars?
AnswerCorrect option: D. $(A)$ and $(C)$ both
A bar graph is a graphical representation of data using bars of different heights.
Histogram is also a graphical representation of data using bars of different heights but it groups the numbers into ranges.
View full question & answer→MCQ 771 Mark
If we join $(-3, 2), (-3, -3)$ and $(-3, 4)$, then we obtain:
- A
- ✓
Straight-line without passing through origin.
- C
Straight-line passing through origin.
- D
AnswerCorrect option: B. Straight-line without passing through origin.
Straight-line without passing through origin.
View full question & answer→MCQ 781 Mark
Find the coordinates of the point $B$ from the graph.
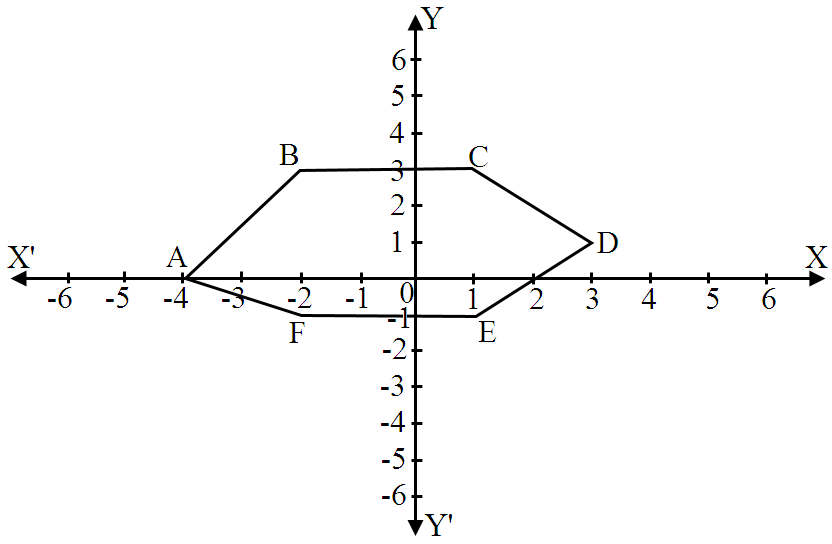
- ✓
$(-2, 3)$
- B
$(0, -4)$
- C
$(-4, 5)$
- D
AnswerCorrect option: A. $(-2, 3)$
$(-2, 3)$
View full question & answer→MCQ 791 Mark
If we join $(-3, 2), (-3, -3)$ and $(-3, 4),$ then we obtain:
- ✓
Straight-line without passing through origin.
- B
- C
Straight-line passing through origin.
- D
AnswerCorrect option: A. Straight-line without passing through origin.
Straight-line without passing through origin.
View full question & answer→MCQ 801 Mark
Observe the following temperature time graph and answer the related questions:

$103^\circ F$ temperature is at time. - ✓
$11$ hours
- B
$13$ hours
- C
$15$ hours
- D
$21$ hours
AnswerCorrect option: A. $11$ hours
$103^\circ F \rightarrow 11 hours$
View full question & answer→MCQ 811 Mark
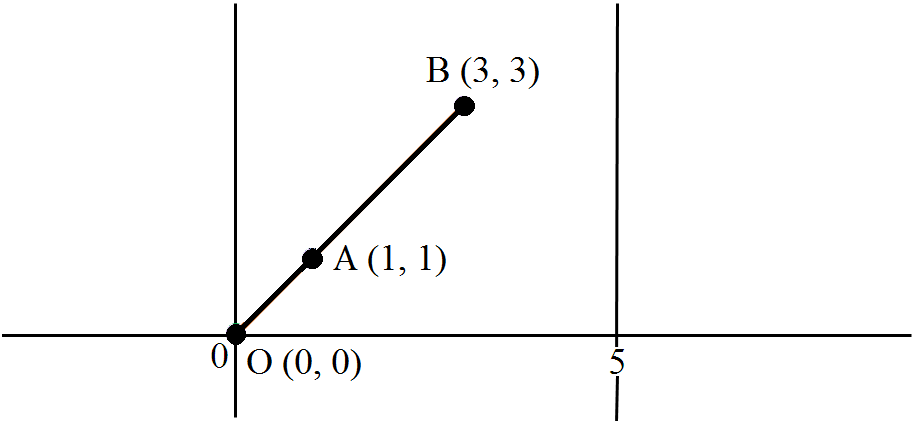
By joining $(-1, -1), (0, 0)$ and $(3, 3)$ represent:
- A
- B
- ✓
A straight line passing through origin.
- D
A straight line not passing through origin.
AnswerCorrect option: C. A straight line passing through origin.
Given: the three points $(1, 1), (0, 0)$ and $(3, 3)$ To find:
What is represented by the joining of the points given Refer to the attachment.
The origin $O (0, 0), A (1, 1)$ and $B (3, 3)$ make a straight line passing through the origin. If we want to find the equation of the straight line that passes through the given points:
$\frac{\text{y}-0}{0-1}=\frac{\text{x}-0}{0-1}$
or, $\frac{\text{y}}{(-1)}=\frac{\text{x}}{(-1)}$
or, $\text{y}=\text{x}$
This is the required line.
View full question & answer→MCQ 821 Mark
By joining $(-3, 2), (-3, -3)$ and $(-3, 4)$, which of the following is obtained?
- A
- ✓
A straight line not passing through origin.
- C
A straight line passing through origin.
- D
AnswerCorrect option: B. A straight line not passing through origin.
View full question & answer→MCQ 831 Mark
Observe the diagram, given below and find the correct answer to the following $MCQ$s.
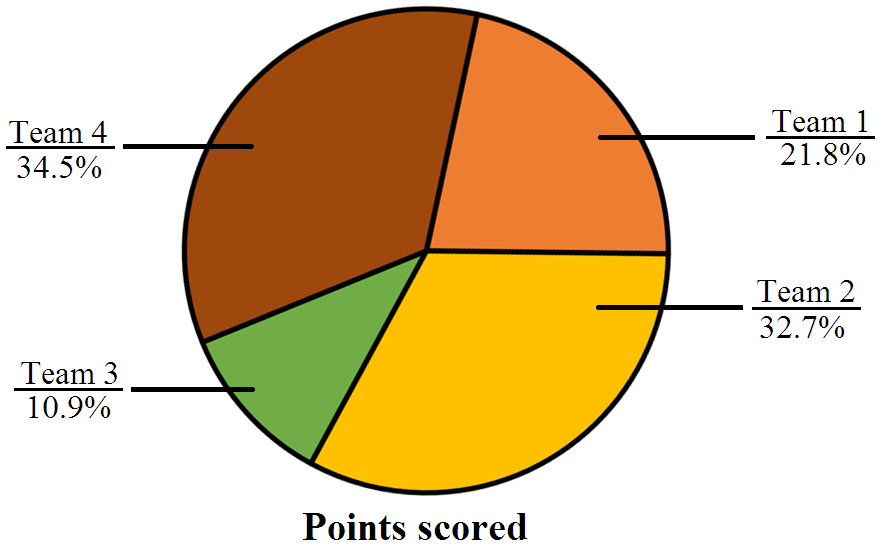
Which team has the lowest score? - ✓
Team $3$
- B
Team $1$
- C
Team $4$
- D
Team $2$
AnswerCorrect option: A. Team $3$
Team $3$ has the lowest score with $10.9\%.$
View full question & answer→MCQ 841 Mark
Read the graph and answer the related questions:

In which year did the maximum number of students appear?
- ✓
$2002$
- B
$2000$
- C
$2001$
- D
$1999$
AnswerCorrect option: A. $2002$
View full question & answer→MCQ 851 Mark
The following graph shows the temperature forecast & the actual temperature for each day of a week. On the basis of the graph, answer the following questions.

What was the minimum forecast temperature during the week?
- A
$35^\circ C$
- B
$25^\circ C$
- C
$30^\circ C$
- ✓
$15^\circ C$
AnswerCorrect option: D. $15^\circ C$
$15^\circ C$
View full question & answer→MCQ 861 Mark
The point $(-5, 2)$ is nearer to:
AnswerCorrect option: B. $X-$axis
$X-$axis
View full question & answer→MCQ 871 Mark
The following line graph shows the yearly sales figures for a manufacturing company. What were the sales in $2005?$
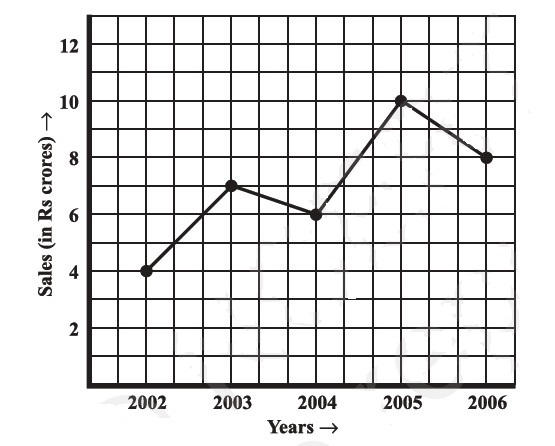
AnswerFrom the graph the value on $y−$axis (denoting sales) for the year $2005$ is Rs. $10$ crore.
View full question & answer→MCQ 881 Mark
Observe the following temperature time graph and answer the related questions:
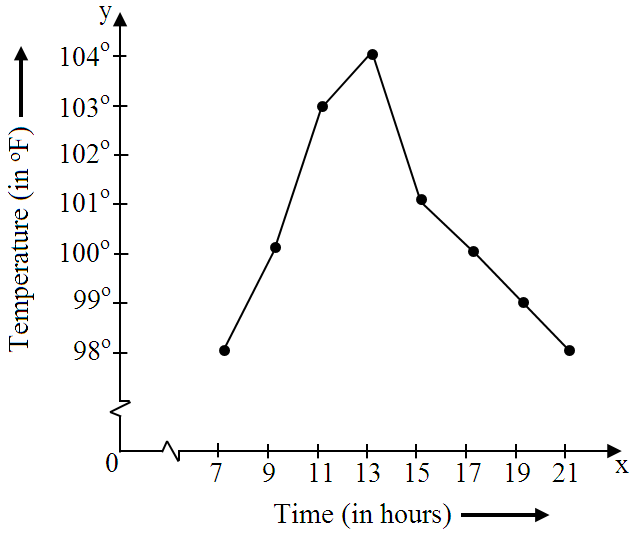
At what time(s) is the temperature minimum?
- ✓
$7$ hours and $21$ hours
- B
$9$ hours
- C
$11$ hours
- D
$13$ hours
AnswerCorrect option: A. $7$ hours and $21$ hours
$7, 21 \rightarrow 98^\circ F$
View full question & answer→MCQ 891 Mark
A is used to compare the parts of the whole.
AnswerA pie$-$graph is used to compare the parts of the whole.
View full question & answer→MCQ 901 Mark
On joining the points if we get a straight line, that graph is called.
AnswerA chart which displays information as a series of data points connected by straight line is known as line graph.
View full question & answer→MCQ 911 Mark
The point $(0, 0)$ lies at:
View full question & answer→MCQ 921 Mark
Observe the following runs-over graph and answer the related questions:
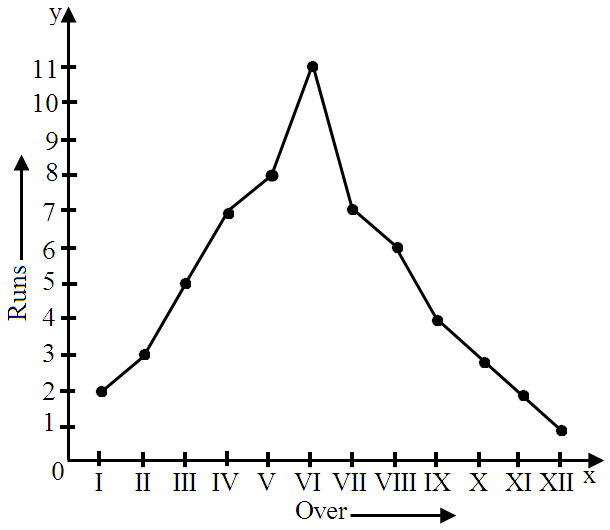
What is the sum of runs scored in $I$ and $XII$ overs? View full question & answer→MCQ 931 Mark
A point which lies on both the axes is:
- ✓
$(0, 0)$
- B
$(0, 1)$
- C
$(1, 0)$
- D
$(1, 1)$
AnswerCorrect option: A. $(0, 0)$
We know that, the axes are two mutually perpendicular lines intersecting each other at the point $(0, 0)$ also known as the origin.
Hence, the point which lies on both the axes is $(0, 0).$
View full question & answer→MCQ 941 Mark
Below is the data of the number of men and women in a village for different years. Now based on this data answer the following $MCQ$s with the correct option.
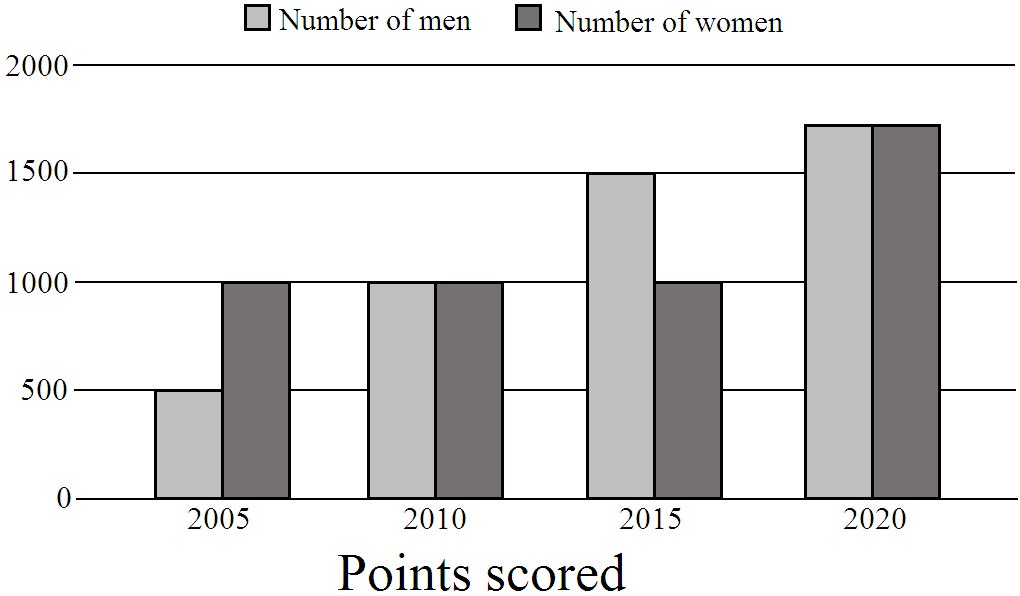
In which year population of men is more than women? - A
$2005$
- B
$2010$
- C
$2020$
- ✓
$2015$
AnswerCorrect option: D. $2015$
$2015$
View full question & answer→MCQ 951 Mark
A $............$ is a bar graph that shows data in intervals.
- ✓
- B
Bar$-$graph
- C
Pie$-$chart
- D
View full question & answer→MCQ 961 Mark
Read the graph and answer the related questions:

The difference in the maximum and minimum rates of interest was.
MCQ 971 Mark
Observe the following temperature time graph and answer the related questions:

What is the difference of temperatures at $7$ hours and $21$ hours? - ✓
$0^\circ F$
- B
$1^\circ F$
- C
$2^\circ F$
- D
$3^\circ F$
AnswerCorrect option: A. $0^\circ F$
$98 - 98 = 0$
View full question & answer→MCQ 981 Mark
Read the graph and answer the related questions:

What was the difference of the number of labourers in the years $2002$ and $2003?$ Answer$2002 \rightarrow 300$
$2003 \rightarrow 500$
$500 - 300 = 200$
View full question & answer→MCQ 991 Mark
Find the coordinates of the point $C$ from the graph.

- ✓
$(1, 3)$
- B
$(-4, 5)$
- C
$(0, -4)$
- D
AnswerCorrect option: A. $(1, 3)$
$(1, 3)$
View full question & answer→MCQ 1001 Mark
Observe the following bar graph and answer the related questions:

On which two heads, is the expenditure same?
- A
Salary of employees and others.
- ✓
Travelling allowance and rent.
- C
- D
AnswerCorrect option: B. Travelling allowance and rent.
The lengths of the bars corresponding to the heads travelling allowance and rent are the same.
View full question & answer→