Questions · Page 3 of 4

M.C.Q. [1 Marks Each]

MCQ 1011 Mark
Observe the following velocity-time graph and answer the related questions:

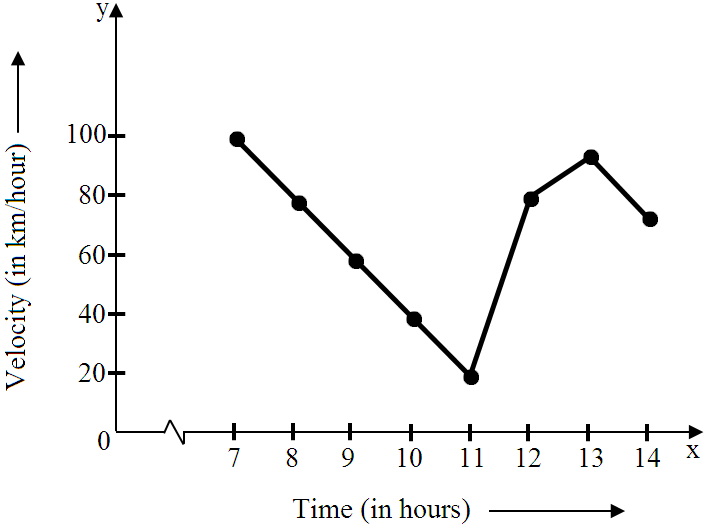
At what times are the velocities equal?
  • $8$ and $12$
  • B
    $9$ and $11$
  • C
    $7$ and $12$
  • D
    $11$ and $13$
Answer
Correct option: A.
$8$ and $12$
$8 \rightarrow 80$
$12 \rightarrow 80$
View full question & answer
MCQ 1021 Mark
The line graph shows the monthly expenditure of Vasu family. The total expenditure over the first $3$ months is:
  • A
    Rs.$320$
  • B
    Rs.$600$
  • C
    Rs.$1100$
  • Rs.$1400$
Answer
Correct option: D.
Rs.$1400$

In the graph, $1$ unit on y-axis $= Rs.100$
The monthly expenses of Basu family in the month of,
In January, the expenditure is marked upto $5$ units $= Rs.500$
In February, the expenditure is marked upto $6$ units $= Rs.600$
In March, the expenditure is marked upto $3$ units $= Rs.300$
$\therefore$ The total expenditure over the first $3$ months $= Rs.(500 + 600 + 300) = Rs.1400$

View full question & answer
MCQ 1031 Mark
Find the distance covered in $3$ seconds.
  • $15\ m$
  • B
    $10\ m$
  • C
    $5\ m$
  • D
    $20\ m$
Answer
Correct option: A.
$15\ m$
$15\ m$
View full question & answer
MCQ 1041 Mark
The graph represents the relation between dependent variable and:
  • A
    $x-$axis
  • B
    $y-$axis
  • C
    Dependent variable
  • Independent variable
Answer
Correct option: D.
Independent variable
The graph represents the relation between dependent variable and independent variable.
View full question & answer
MCQ 1051 Mark
Refer the given graph and answer the following question: A survey was conducted in a class to see how many girls and boys like a particular ice cream flavour. How many more girls like the chocolate flavour than the boys?
  • A
    $0$
  • B
    $15$
  • C
    $10$
  • $5$
Answer
Correct option: D.
$5$

For chocolate, number of girls $= 25$ and number of boys $= 20$
Difference $= 25 - 20 = 5$

View full question & answer
MCQ 1061 Mark
Observe the following temperature time graph and answer the related questions:

What is the fall in temperature from $13$ hours to $21$ hours?
  • A
    $2^\circ F$
  • B
    $3^\circ F$
  • C
    $4^\circ F$
  • $6^\circ F$
Answer
Correct option: D.
$6^\circ F$
$104 - 98 = 6$
View full question & answer
MCQ 1071 Mark
Read the graph and answer the related questions:

How many books are there in Sanskrit and Home Science taken together?
  • A
    $100$
  • B
    $200$
  • $300$
  • D
    $400​​​​​​$
Answer
Correct option: C.
$300$
Sanskrit $\rightarrow 200$
Home Science $\rightarrow 100$
$200 + 100 = 300$
View full question & answer
MCQ 1081 Mark
The width of the bars does not matter in _____ graph.
  • A
    line
  • B
    histogram
  • C
    pie
  • bar
Answer
Correct option: D.
bar
The width of the bars does not matter in bar graph.
The width of the bars does not matter in graph.
View full question & answer
MCQ 1101 Mark
Observe the following velocity-time graph and answer the related questions:

At what time is the velocity maximum?
  • $7$
  • B
    $8$
  • C
    $9$
  • D
    $10$
Answer
Correct option: A.
$7$
$7 \rightarrow 100$
View full question & answer
MCQ 1111 Mark
Which point lies of $y-$axis?
  • A
    $(-2, 0)$
  • B
    $(2, 0)$
  • $(0, -2)$
  • D
    $(2, -2)$
Answer
Correct option: C.
$(0, -2)$
$(0, -2)$
View full question & answer
MCQ 1121 Mark
Which graphs of the following represent the table below?
Length of Side of a Square $1$ $2$ $3$ $4$ $5$
Perimeter $4$ $8$ $12$ $16$ $20$
  • A
  • B
  • C
Answer
Correct option: D.

Here, the lengths of sides of squares are represented on $X-$axis and their perimeters are represented on $Y-$axis.
The points are $(1, 4), (2, 8), (3, 12), (4, 16)$ and $(5, 20).$
Now, observing all the $4$ graphs carefully we see that these points lie on the graph $(d).$
View full question & answer
MCQ 1131 Mark
Below is the data of the number of men and women in a village for different years. Now based on this data answer the following $MCQ$s with the correct option.

In which year the population of women is the highest?
  • $2020$
  • B
    $2005$
  • C
    $2010$
  • D
    $2015$
Answer
Correct option: A.
$2020$
$2020$
View full question & answer
MCQ 1141 Mark
Which graph displays the data that changes continuously over periods of time?
  • Line graph
  • B
    Circle graph
  • C
    Bar graph
  • D
    Hitogram
Answer
Correct option: A.
Line graph
Line graph displays the data that changes continuously over periods of time.
View full question & answer
MCQ 1151 Mark
Tick the corect answer in the following: In which of the following quadrants does the point $(-7, -1)$ lie?
  • A
    The $x-$axis.
  • B
    The $y-$axis.
  • C
    A line parallel to the $y-$axis.
  • A line parallel to the $x-$axis.
Answer
Correct option: D.
A line parallel to the $x-$axis.
View full question & answer
MCQ 1161 Mark
Pie chart is also known as:
  • A
    Angular graph
  • Circle graph
  • C
    Pie graph
  • D
    Whole graph
Answer
Correct option: B.
Circle graph
Pie chart is also known as circle graph.
View full question & answer
MCQ 1171 Mark
Observe the following temperature time graph and answer the related questions:
What are the coordinates of a point whose $x-$coordinate is $0$ and $y-$coordinate is $1?$
  • $(0, 1)$
  • B
    $(0, 0)$
  • C
    $(1, 0)$
  • D
    $(1, 1)$
Answer
Correct option: A.
$(0, 1)$
$(0, 1)$
View full question & answer
MCQ 1181 Mark
The point $(3, 0)$ lives on which of the following?
  • $X-$axis
  • B
    $Y-$oxis
  • C
    Origin
  • D
    None of these.
Answer
Correct option: A.
$X-$axis

Given, $(3, 0).$
Since the y-coordinate is $0$, the point clearly, lies on $x-$axis. Also, the x-coordinate $3$ being positive, the point lies on the positive $x-$axis.

View full question & answer
MCQ 1191 Mark
A $..........$ is the representation of data by using graphical symbols such as lines, bars, pie slices, histogram etc.
  • A
    flow chart
  • B
    diagram
  • C
    equation
  • graph
Answer
Correct option: D.
graph
A graph is the representation of data by using graphical symbols such as lines, bars, pie slices, histogram etc.
Example: Line graph representing the temperature of $8$ days.

View full question & answer
MCQ 1201 Mark
The line graph shows the yearly sales figure for a manufacturing company. From the graph, what were the sales in $2006?$
  • Rs. $8$ millions
  • B
    Rs. $4$ millions
  • C
    Rs. $3$ millions
  • D
    Rs. $5$ millions
Answer
Correct option: A.
Rs. $8$ millions
Rs. $8$ millions
View full question & answer
MCQ 1211 Mark
Refer the given graph and answer the following question: On which day the number of push-ups done was $0"$
  • A
    Thursday
  • B
    Friday
  • Saturday
  • D
    Sunday
Answer
Correct option: C.
Saturday

From the graph. we can see that number of push-ups done on Saturday are $0.$

View full question & answer
MCQ 1221 Mark
Refer the given pie chart and answer the following question: If $20$ people have rabbits as their pet. then how many people were surveyed?
  • A
    $100$
  • B
    $150$
  • C
    $180$
  • $200$
Answer
Correct option: D.
$200$
Number of people who have rebbits as per $= 10\%$
This $10\%$ represents $20$ people.
So, $100\% =\frac{20\times100}{10}=200$ people
Therefore, $200$ people were surveyed.
View full question & answer
MCQ 1231 Mark
\Find the distance covered in $6$ seconds.
  • $30\ m$
  • B
    $35\ m$
  • C
    $25\ m$
  • D
    None of these.
Answer
Correct option: A.
$30\ m$
$30\ m$
View full question & answer
MCQ 1241 Mark
The point $(-5, 2)$ is nearer to:
  • A
    $X-$axis
  • $Y-$axis
  • C
    Origin
  • D
    None of the above.
Answer
Correct option: B.
$Y-$axis
$Y-$axis
View full question & answer
MCQ 1251 Mark
A line graph which is a whole unbroken line is called a:
  • A
    Pie$-$chart
  • Linear graph
  • C
    Histograph
  • D
    Bar$-$graph
Answer
Correct option: B.
Linear graph
Linear graph
View full question & answer
MCQ 1261 Mark
$(O, Y)$ are the co-ordinates of a point lying on which of the following?
  • A
    Origin
  • $Y-$axis
  • C
    $X-$axis
  • D
    None of these.
Answer
Correct option: B.
$Y-$axis
$Y-$axis
View full question & answer
MCQ 1271 Mark
In the given figure the position of the book on the table may be given by:
  • A
    $(7, 3)$
  • $(3, 7)$
  • C
    $(3, 3)$
  • D
    $(7, 7)$
Answer
Correct option: B.
$(3, 7)$
The book is at a distance of $3$ units from $Y-$axis and $7$ units from $X-$axis.
Hence, the position of the book on the table is given by $(3, 7).$
View full question & answer
MCQ 1281 Mark
Read the graph and answer the related questions:

Find the sum of the number of labourers in the years $2004$ and $2006.$
  • $700$
  • B
    $600$
  • C
    $200$
  • D
    $500$
Answer
Correct option: A.
$700$
$2004 \rightarrow 600$
$2006 \rightarrow 100$
$600 + 100 = 700$
View full question & answer
MCQ 1291 Mark
Observe the diagram, given below and find the correct answer to the following $MCQ$s.
Which team is coloured green?
  • A
    Team $1$
  • B
    Team $4$
  • C
    Team $2$
  • Team $3$
Answer
Correct option: D.
Team $3$
Team $3$
View full question & answer
MCQ 1301 Mark
Read the graph and answer the related questions:

What is the maximum number of students that appeared in any year?
  • $350$
  • B
    $300$
  • C
    $250$
  • D
    $300$
Answer
Correct option: A.
$350$
$350$
View full question & answer
MCQ 1311 Mark
Refer the given pie chart and answer the following question:
$200$ people are surveyed about the pet they own. Find the central angle for fishes.
  • $54^\circ $
  • B
    $30^\circ$
  • C
    $50^\circ$
  • D
    $90^\circ$
Answer
Correct option: A.
$54^\circ $
Since $200$ people are surveyed and we need to find $15\%$ of $200$
So, $15\%$ of $200$ $=\frac{15}{100}\times200=30$
Therefore, $30$ people have fishes as their pets.
Now, fraction of people who have fishes $=\frac{30}{200}$
Central angle $=\frac{30}{200}\times360=54^\circ$
View full question & answer
MCQ 1321 Mark
Observe the diagram, given below and find the correct answer to the following $MCQ$s.
Which team has the highest score?
  • A
    Team $2$
  • B
    Team $3$
  • Team $4$
  • D
    Team $1$
Answer
Correct option: C.
Team $4$
Team $4$ has the highest score with $34.5\%.$
View full question & answer
MCQ 1331 Mark
What is the approximate ratio of the sales of Medimix in $2007$ to the sales of Hamam in $2010?$
  • $3:2$
  • B
    $1:3$
  • C
    $2:3$
  • D
    $3:1$
Answer
Correct option: A.
$3:2$
The approximate ratio of the sales of Medimix in $2007$ to the sales of Hamam in $2010$ is:
Required ratio $ =\frac{10}{15​}$
Ratio $= 3:2$
View full question & answer
MCQ 1341 Mark
Refer the given graph and answer the following question: How many more push-ups are needed to be done on Thursday so that 1t equals the number of push-ups on Wednesday?
  • $20$
  • B
    $25$
  • C
    $15$
  • D
    $10$
Answer
Correct option: A.
$20$
On thusday, it's $5$ push-ups. On Wednesday, it's $25$ push-ups. So we need $25 - 5 = 20$ more push-ups.
View full question & answer
MCQ 1351 Mark
A graph that displays data that changes continuously over periods of time is called :
  • Line Graph
  • B
    Bar$-$graph
  • C
    Pie$-$chart
  • D
    Histograph
Answer
Correct option: A.
Line Graph
Line Graph
View full question & answer
MCQ 1361 Mark
Read the graph and answer the related questions:

The maximum books are of which subject?
  • Hindi
  • B
    Science
  • C
    English
  • D
    Sanskrit.
Answer
Correct option: A.
Hindi

Hindi $\rightarrow 600$

View full question & answer
MCQ 1371 Mark
Observe the following bar graph and answer the related questions:

On which head/ heads, is the expenditure minimum?
  • Travelling allowance/ rent.
  • B
    Appliances.
  • C
    Salary of employees.
  • D
    Others.
Answer
Correct option: A.
Travelling allowance/ rent.
The length of the bar corresponding to the head travelling allowance/ rent is minimum.
View full question & answer
MCQ 1381 Mark
In which city number of people watching $T.V$ is same as people reading newspaper?
  • A
    Delhi
  • B
    Mumbai
  • Kolkata
  • D
    Patna
Answer
Correct option: C.
Kolkata
In Kolkata people watching $T.V$ is same as reading newspaper i.e $30.$
View full question & answer
MCQ 1391 Mark
Observe the following bar graph and answer the related questions:

What is the difference of expenditures (in thousands of rupees) on salary of employees and rent?
  • A
    $100$
  • B
    $200$
  • $300$
  • D
    $400$
Answer
Correct option: C.
$300$

$400 - 100 = 300$

View full question & answer
MCQ 1401 Mark
A graph that displays data that changes continuously over periods of time is:
  • A
    Bar graph.
  • B
    Pie chart.
  • C
    Histogram.
  • Line graph.
Answer
Correct option: D.
Line graph.
Line graph is an important way to represent and compare the data which varies continuously.
A line graph displays the relation between two varying quantities.
In a line graph, we connect all the points by a line segment while in bar graph and histogram, we use rectangles of uniform width.
View full question & answer
MCQ 1411 Mark
Find the distance covered in $5$ seconds.
  • $25\ m$
  • B
    $10\ m$
  • C
    $20\ m$
  • D
    None of these.
Answer
Correct option: A.
$25\ m$
$25\ m$
View full question & answer
MCQ 1421 Mark
Observe the following velocity-time graph and answer the related questions:

What is the fall in velocity from $7$ to $11?$
  • A
    $80\ km/ hour$
  • B
    $90\ km/ hour$
  • C
    $100\ km/ hour$
  • $20\ km/ hour$
Answer
Correct option: D.
$20\ km/ hour$

$80 - 20 = 60$

View full question & answer
MCQ 1431 Mark
Observe the diagram, given below and find the correct answer to the following $MCQs$.
What is the average score of all the teams?
  • A
    $22\%$
  • B
    $27\%$
  • C
    $29\%$
  • $25\%$
Answer
Correct option: D.
$25\%$

Average score = (sum of all scores)/(total number of scores)

View full question & answer
MCQ 1441 Mark
Find the coordinates of the point E from the graph.
  • $(1, -1)$
  • B
    $(-4, 5)$
  • C
    $(0, -4)$
  • D
    None of these.
Answer
Correct option: A.
$(1, -1)$
$(1, -1)$
View full question & answer
MCQ 1451 Mark
Which of the following points lies on $y-$axis?
  • A
    $(-4, 0)$
  • B
    $(4, 0)$
  • $(0, -4)$
  • D
    $(-4, 4)$
Answer
Correct option: C.
$(0, -4)$
Clearly the point $(0, 4)$ lies on $y-$axis, because it has zero $x$ co-ordinate and $y$ co-ordinate.z
View full question & answer
MCQ 1461 Mark
The following graph shows the temperature forecast $\&$ the actual temperature for each day of a week. On the basis of the graph, answer the following questions.

On which days was the forecast temperature the same as the actual temperature?
  • A
    Monday, Tuesday.
  • Tuesday, Friday, Sunday.
  • C
    Monday, Tuesday, Wednesday.
  • D
    Tuesday, Saturday, Sunday.
Answer
Correct option: B.
Tuesday, Friday, Sunday.
View full question & answer
MCQ 1471 Mark
The frequency curve is similar to $.........$
  • A
    histogram graph
  • line graph
  • C
    bar graph
  • D
    pie graph
Answer
Correct option: B.
line graph
The frequency curve is similar to line graph.
Because both the graph represents the data in line segment.
View full question & answer
MCQ 1481 Mark
Observe the following temperature time graph and answer the related questions:

At what time is the temperature maximum?
  • $13$ hours
  • B
    $15$ hours
  • C
    $11$ hours
  • D
    $19$ hours
Answer
Correct option: A.
$13$ hours
$13$ hours $\rightarrow 104^\circ F$
View full question & answer
MCQ 1491 Mark
Read the graph and answer the related questions:

The fall in interest from $2001$ to $2002$ was.
  • A
    $1\%$
  • $2\%$
  • C
    $3\%$
  • D
    $4\%$
Answer
Correct option: B.
$2\%$

$10 - 8 = 2$

View full question & answer
MCQ 1501 Mark
Observe the following circle-graph and answer the related questions:

If the budget of the family is Rs. $10800$, what is the saving?
  • Rs. $1050$
  • B
    Rs. $1000$
  • C
    Rs. $950$
  • D
    Rs. $1200$
Answer
Correct option: A.
Rs. $1050$
Saving $=\frac{35}{360}\times10800=1050$
View full question & answer
M.C.Q. [1 Marks Each] - Page 3 - MATHS STD 8 Questions - Vidyadip