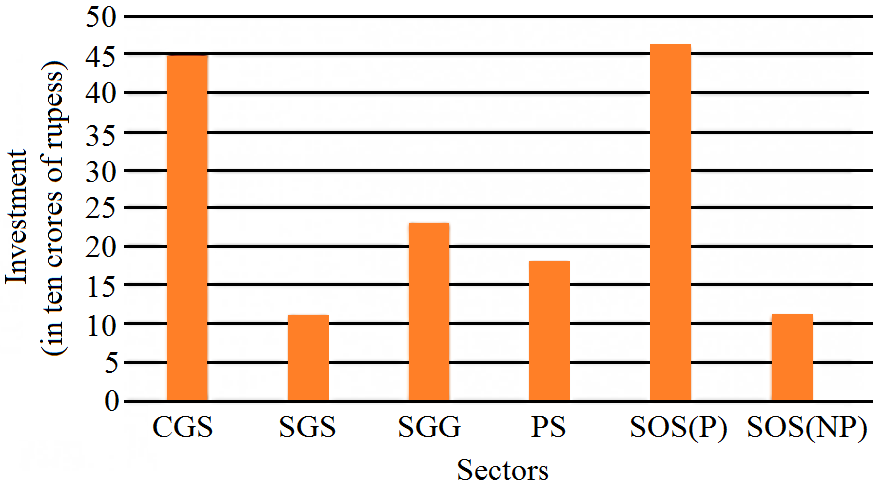
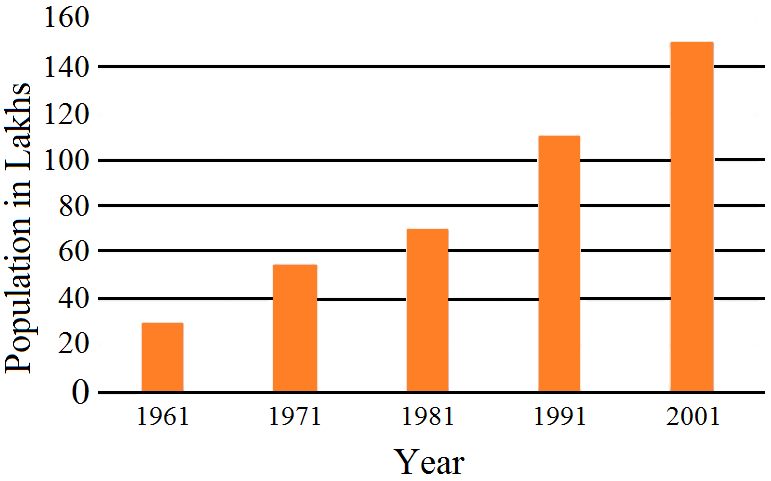
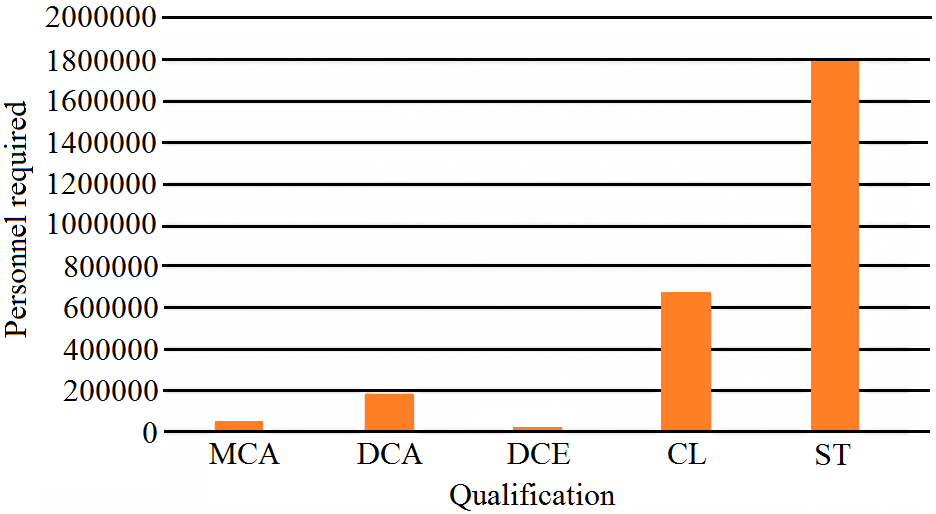
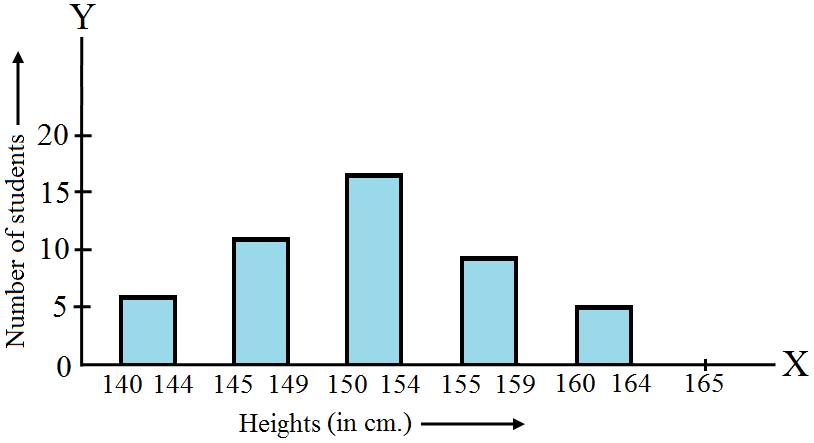
Question 15 Marks
Read the following bar graph and answer the following questions:
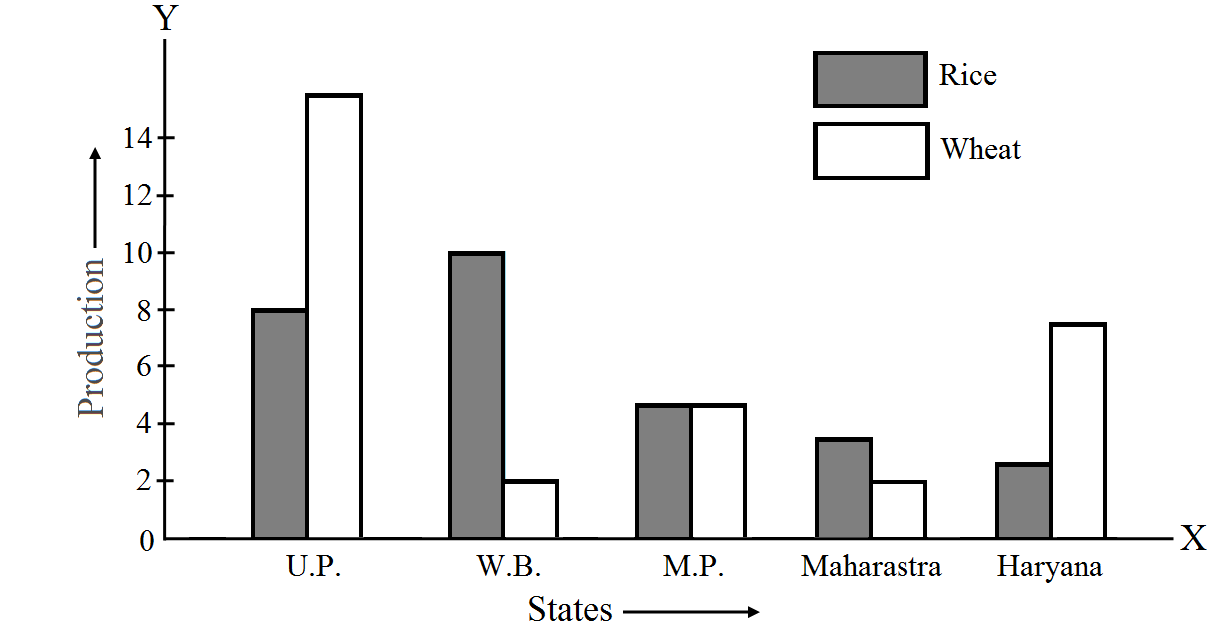
$i.$ What information is given by the bar graph$?$
$ii.$ Which state is the largest producer of rice$?$
$iii.$ Which state is the largest producer of wheat$?$
$iv.$ Which state has total production of rice and wheat at its maximum$?$
$v.$ Which state has total production of wheat and rice at its minimum$?$
Answer
View full question & answer→$i.$ The bar graph represents the production of rice and wheat in different states of India.
$ii.$ According to the height of the bars corresponding to rice, $W.B.$ is the largest producer of rice.
$iii.$ According to the height of the bars corresponding to wheat. $U.P.$ is the largest producer of wheat.
$iv. U.P.$ has the maximum total production of rice and wheat, which is $8 + 16 = 24$ units
$v.$ Maharashtra has the minimum total production of rice and wheat, which are exactly $2 + 4 = 6$ units.