Questions

4 Marks Question

🎯

Test yourself on this topic

33 questions · timed · auto-graded

Question 14 Marks
Compute coefficient of correlation from the following data:
  X series Y series
Mean 15 28
Sum of squares of deviation 144 225
Sum of products of deviation of X and Y series from their respective mean is 20. Number of pairs of observations is 10.
Answer
Given, $\Sigma\text{x}^2=144,\Sigma\text{y}=225,\Sigma\text{xy}=20,\text{n}=10$$\text{r}=\frac{\Sigma\text{xy}}{\sqrt\Sigma\text{x}^2\Sigma\text{y}^2}=\frac{20}{\sqrt{144\times225}}$
$=\frac{20}{\sqrt{32400}}=\frac{20}{80}=+0.11 $
View full question & answer
Question 24 Marks
Measure the height of your classmates. Ask them the height of their benchmate. Calculate the correlation coefficient of these two variables. Interpret the result.
Answer
(Hypothetical example, results may vary)
Height of Classmates (X)
Height of benchmates (Y)
$\text{X}-\overline{\text{X}}$
$\big(\text{X}-\overline{\text{X}}\big)^2$
$\text{Y}-\overline{\text{Y}}$
$\big(\text{Y}-\overline{\text{Y}}\big)^2$
$\big(\text{X}-\overline{\text{X}})(\text{Y}-\overline{\text{Y}})$
5.5
4.5
0
0
-0.5
0.25
0
5.2
5.6
-0.3
0.09
0.6
0.36
-0.18
5.4
5.0
-0.1
0.01
0
0
0
5.5
5.0
0
0
0
0
0
5.6
5.4
0.1
0.01
0.4
0.16
0.04
5.8
4.5
0.3
0.09
-0.5
0.25
-0.15
$\sum\text{X}=33 $
$\sum\text{Y}=30$
 
$\sum(\text{X}-\overline{\text{X}})^2=0.20$
 
$(\text{Y}-\overline{\text{Y}})^2=1.02$
$\sum(\text{X}-\overline{\text{X}})(\text{Y}-\overline{\text{Y}})=-0.29$
$\text{r}=\frac{\sum\big(\text{X}-\overline{\text{X}}\big)\big(\text{Y}-\overline{\text{Y}}\big)}{\sqrt{\sum\big(\text{X}-\overline{\text{X}}\big)^2\big(\text{Y}-\overline{\text{Y}}\big)^2}}=-0.613$
Correlation coefficient between the height of classmate and height of his bench mate are negatively related.
View full question & answer
Question 34 Marks
List some variables where accurate measurement is difficult.
Answer
List of variables where accurate measurement is difficult:
  1. Qualitative variables such as:
  • Beauty and income earned through modelling.
  • Honesty and job opportunities in the market.
  1. Subjective variables such as:
  • Poverty and growth of population.
  • Development and infrastructural facilities.
View full question & answer
Question 44 Marks
Calculate coefficient of correlation from the given data:
X
0
2
4
6
8
10
12
Y
4
4
6
10
10
8
7
Answer
$X$ $X^2$ $Y$ $Y^2$ $XY$
0 0 4 16 0
2 4 4 16 8
4 16 6 36 24
6 36 10 100 60
8 64 10 100 80
10 100 8 64 80
12 144 7 49 84
$\Sigma\text{X}=42$ $\Sigma\text{X}^2=364$ $\Sigma\text{Y}=49$ $\Sigma\text{Y}^2=381$ $\Sigma\text{XY}=336$
$\text{r}=\frac{\text{N}\times\Sigma\text{XY}-\Sigma\text{X}\times\Sigma\text{Y}}{\sqrt{\text{N}\times\Sigma\text{X}^2-(\Sigma\text{X})^ 2}\sqrt{\text{N}\times\Sigma\text{Y}^2-(\Sigma\text{Y})^2}}$
$=\frac{7\times336-(42)(49)}{\sqrt{7\times364-(42)^2}\sqrt{7\times381-(49)^2}}$
$=\frac{2352-2058}{\sqrt{2548-1764}\sqrt{2627-2401}}$
$=\frac{294}{\sqrt{784}\sqrt{266}}=\frac{294}{28\times16.30}=\frac{294}{456.67}$
$=0.64$
View full question & answer
Question 54 Marks
We are given the % of marks scored by six students in two subjects. Calculate co-efficient of rank co-relation.
Student A B C D E F
Marks in Mathematics 85 60 55 65 75 90
Marks in Economics 60 48 49 50 55 62
Answer
Marks in Mathmatics (X) $R_1$ Marks in Economics (Y) $R_2$ $D = R_1 - R_2$ $D_2$
85 2 60 2 0 0
60 5 48 6 -1 1
55 6 49 5 1 1
65 4 50 4 0 0
75 3 55 3 0 0
90 1 62 1 0 0
          $\Sigma\text{D}^2=2$
$\text{r}_\text{s}=1-\frac{6\Sigma\text{D}^2}{\text{N}^3-\text{N}}$
$=1-\frac{6\times2}{6^3-6}$
$=1-\frac{12}{210}$
$=1-0.06$
$=0.94$
View full question & answer
Question 64 Marks
Calculate Spearman's Rank coefficient of correlation from following data:
X 66 90 89 55 58 44 42
Y 58 76 65 58 53 49 56
Answer
Spearman's Rank coefficient of correlation:
$X$ $Y$ $R_1$ $R_2$ $D = R_1 - R_2$ $D^2$
66 58 3 3.5 -0.5 0.25
90 76 1 1 0 0
89 65 2 2 0 0
55 58 5 3.5 1.5 2.25
58 53 4 6 -2 4.00
44 49 6 7 -1 1.00
42 56 7 5 2 4.00
  $\Sigma\text{D}^2=11.50$
$\text{r}_\text{s}=1-\frac{6\Big[\Sigma\text{D}^2+\frac1{12}(\text{m}^3-\text{m})\Big]}{\text{n}^3-\text{n}}$
$=1-\frac{6\Big[11.5+\frac1{12}(2\times2\times2-2)\Big]}{7^3-7}$
$=1-\frac{6[11.5+0.5]}{336}=1-\frac{72}{336}=0.79$
View full question & answer
Question 74 Marks
The ranking of ten students in two subjects Economics and Statistics is as below:
Economics $3$ $5$ $8$ $4$ $7$ $10$ $2$ $1$ $6$ $9$
Statistics $6$ $4$ $9$ $8$ $1$ $2$ $3$ $10$ $5$ $7$
What is the coefficient of rank correlation?
Answer
$R_1$
$R_2$
$D = R_1 - R_2$
$D^2$
$3$
$6$
$-3$
$9$
$5$
$4$
$1$
$1$
$8$
$9$
$-1$
$1$
$4$
$8$
$-4$
$16$
$7$
$1$
$6$
$36$
$10$
$2$
$8$
$64$
$2$
$3$
$-1$
$1$
$1$
$10$
$-9$
$81$
$6$
$5$
$1$
$1$
$9$
$7$
$2$
$4$
$N = 10$
 
 
$\Sigma\text{D}^2=214$
$\text{r}_\text{s}=1-\frac{6\Sigma\text{D}^2}{\text{N}^3-\text{N}}$
$=1-\frac{6\times214}{10^3-10}=1-\frac{1284}{990}=-0.29$
View full question & answer
Question 84 Marks
Consider the examples given below:
  1. As price falls, demand for product 'A' increases.
  2. Effect of adequate irrigation facilities, fertilisers and pesticides on per hectare productivity of wheat.
On the basis of above examples explain the main difference between simple correlation and multiple correlation.
Answer
The first example involves only two variables, viz. price and demand. Therefore, it relates to simple correlation.
The second example involves more than two variables, i.e. how the productivity of wheat is affected by use of irrigation facilities, fertilisers and pesticides. Therefore, it relates to multiple correlation.
The main difference between simple correlation and multiple correlation is:
S. No.
Simple Correlation
Multiple Correlation
(i)
When the relationship between only two variables is studied, it is called simple correlation.
When the relationship among three or more than three variables is studied simultaneously, it is called multiple correlation.
View full question & answer
Question 94 Marks
Scatter diagram studies correlation between two variables but it does not measure the precise extent of correlation. In the context of above statement explain the advantages and disadvantages of scatter diagram.
Answer
In the context to the above statement the main advantages of scatter diagram are:
  1. It is a simple and a non-mathematical method of studying correlation between two variables.
  2. It can be easily understood and interpreted.
  3. It is not influenced by the size of extreme values.
In the context to the above statement the main disadvantages of scatter diagram are:
  1. It is only a qualitative expression rather than a quantitative expression.
  2. It gives only a broad and rough idea of the degree and nature of correlation between two variables.
  3. This method does not indicate the exact numerical value of correlation.
View full question & answer
Question 104 Marks
What are the merits and limitations of Spearman's rank correlation?
Answer
Merits of Rank Correlation:
  1. Since in this method $\Sigma\text{d}$ or the sum of the differences between R1, and R2 is always equal to zero, it provides a check on the calculation.
  2. Since Spearman's Rank Correlation is the same thing as Karl Pearson's Coefficient of Correlation between ranks, it can be interpreted in the same way as Karl Pearson's Coefficient of correlation.
  3. Rank correlation unlike Karl Pearson's Coefficient of Correlation does not assume normality in the universe from which the sample has been taken.
  4. Rank Correlation is very easy to understand and apply.' However Pearson's Coefficient is based on a set of full information while Spearman's Coefficient is based only on the ranks. The values of obtained by these two methods would generally differ.
  5. Spearman's Rank method is the only way of studying correlation between qualitative data which cannot be measured in figures but can be arranged in serial order.
Demerits of Rank Correlation:
  1. The method cannot be used in two-way 37 frequency tables or bi-variate frequency distribution.
  2. It can be conveniently used only when n is small say 30, otherwise calculation become tedious.
View full question & answer
Question 114 Marks
Draw a scatter diagram and interpret whether the correlation is positive or negative.
X
4
5
6
7
8
9
10
11
12
13
14
15
Y
78
72
66
60
54
48
42
36
30
24
18
12
Answer

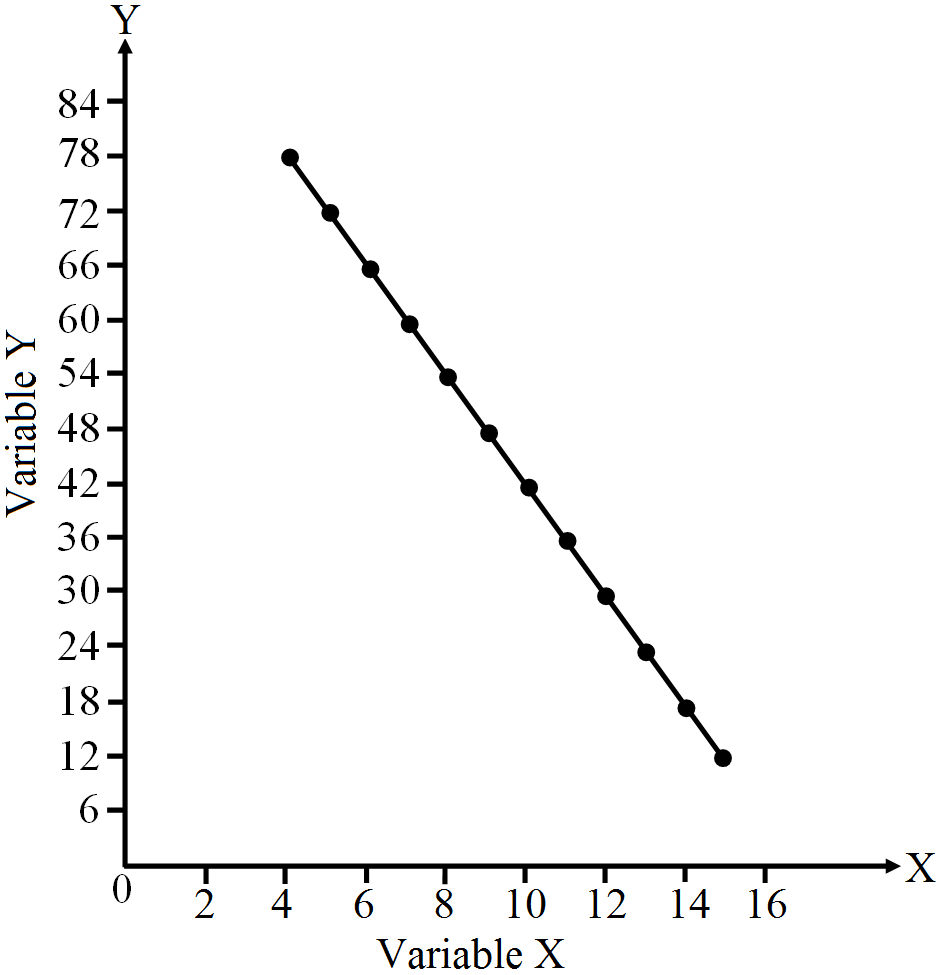
Interpretation: The diagram indicates that there is “perfect negative correlation” between of the two variables X and Y.
View full question & answer
Question 124 Marks
Calculate the coefficient of correlation from the following data:$\text{Cov.}(\text{X,Y})=488,\sigma_\text{x}=28.70,\sigma_\text{y}=18.2\text{N}=10$
Answer
$\text{r}=\frac{\text{Cov. (X,Y)}}{\sqrt{\text{Var. (X)}}\sqrt{\text{Var. (Y)}}}$$=\frac{488}{\sqrt{823.69}\sqrt{324.72}}$
$=\frac{488}{28.70\times18.01}=\frac{488}{516.8}=0.94$
High degree of correlation prevails between X and Y.
View full question & answer
Question 134 Marks
Calculate coefficient of correlation between age group and rate of mortality from the following data.
Age Group
0-20
20-40
40-60
60-80
80-100
Rate of Mortality
350
280
540
760
900
Answer
Since, class intervals are given for age, so mid value should be used for the calculation of r.
Age Group Mid Value(x) dx(X - A) A = 50 $\text{dx}'\bigg(\frac{\text{dx}}{\text{c}_1}\bigg)\text{c}_1=20$ $\text{dx}^2$ Rate of mortality(Y) dy(Y - A) A = 540 $\text{dy}'\bigg(\frac{\text{dx}}{\text{c}_2}\bigg)\text{c}_1=10$ $\text{dy}^2$ dx'dy'
0-20 10 -40 -2 4 350 -190 -19 361 38
20-40 30 -20 -1 1 280 -260 -26 676 26
40-60 50 0 0 0 540 0 0 0 0
60-80 70 20 1 1 760 220 +22 484 22
80-100 90 40 2 4 900 360 +36 1296 72
      $\Sigma\text{dx}'=0$ $\Sigma\text{dx}^2=10$     $\Sigma\text{dy}'=13$ $\Sigma\text{dy}^2=2817$ $\Sigma\text{dx}'\text{dy}'=158 $
Here, $\text{n}=5,\Sigma\text{dy}'^2=0,\Sigma\text{dx}'^2=10,\Sigma\text{dy}'=13,\\ \Sigma\text{dy}'^2=2817\ \text{and }\Sigma\text{dx}'\text{dy}'=158 $ Now, $\text{r}=\frac{\Sigma\text{dx}'\text{dy}'-\frac{\Sigma\text{dx}'\times\Sigma\text{dy}'}{\text{n}}}{\sqrt{\Sigma\text{dx}'^2-\frac{(\Sigma\text{dx}')^2}{\text{n}}\times}\sqrt{\Sigma\text{dy'}^2-\frac{(\Sigma\text{dy}')^2}{\text{n}}}}$$=\frac{158-\frac{0\times13}{5}}{\sqrt{10-\frac{(0)^2}{5}\times}\sqrt{2817-\frac{(13)^2}{5}}}=\frac{158}{\sqrt{10-0}\times\sqrt{2817-\frac{169}{5}}}$
$=\frac{158}{\sqrt{10}\times\sqrt{2817-33.8}}$
$=\frac{158}{\sqrt{10}\times\sqrt{2783.2}}=\frac{158}{3.16\times52.8}=\frac{158}{166.8}=+0.95$
There is high degree of positive correlation between age group and rate of mortality.
View full question & answer
Question 144 Marks
Calculate coefficient of correlation by Karl Pearson method.
X
1
3
4
5
8
9
Y
4
6
9
10
15
16
Answer
X $\text{x}=\text{X}-\overline{\text{X}}$ $x^2$ Y $\text{y}=\text{Y}-\overline{\text{Y}}$ $y^2$ xy
1
-4
16
4
-6
36
24
3
-2
4
6
-4
16
8
4
-1
1
9
-1
1
1
5
0
0
10
0
0
0
8
3
9
15
5
25
15
9
4
16
16
6
36
24
$\Sigma\text{X}=30\ \text{N}=6$   $\Sigma\text{x}^2=46$ $\Sigma\text{Y}=60\ \text{N}=6$   $\Sigma\text{y}^2=114$ $\Sigma\text{xy}=72$
$\overline{\text{X}}=\frac{\Sigma\text{X}}{\text{N}}=\frac{30}{6}=5$
$\overline{\text{Y}}=\frac{\Sigma\text{Y}}{\text{N}}=\frac{10}{6}=10$
$\text{r}=\frac{\Sigma\text{XY}}{\sqrt{\Sigma\text{X}^2}.\sqrt{\Sigma\text{Y}^2}}$
$=\frac{72}{\sqrt{46}\times\sqrt{114}}=\frac{72}{\sqrt{5244}}=\frac{72}{72.41}=0.99$
View full question & answer
Question 154 Marks
Given below is the percentage of marks secured by 5 students in Economics and Statistics:
Student A B C D E
Marks in Economics 60 48 49 50 55
Marks in Statistics 85 60 55 65 75
Calculate the coefficient of rank correlation.
Answer
Marks in Economics $(X)$ $R_1$ Marks in statistics $(Y)$ $R_2$ $D = R_1 - R_2$ $D_2$
60 1 85 1 0 0
48 5 60 4 1 1
49 4 55 5 -1 1
50 3 65 3 0 0
55 2 75 2 0 0
N = 5         $\Sigma\text{D}^2=2$
$\text{r}_\text{s}=1-\frac{6\Sigma\text{D}^2}{\text{N}^3-\text{N}}$
$=1-\frac{6\times2}{5^3-5}=1-\frac{12}{120}=1-0.0.1=0.09$
View full question & answer
Question 164 Marks
Two ladies were asked to rank 7 different types of lipstics. The ranks given by them are as follows:
Lipsitics
A
B
C
D
E
F
G
Neelu
2
1
7
3
5
7
6
Neena
1
3
2
4
5
6
7
Calculate Spearman's rank correlation coefficient.
Answer
$R_1$ $R_2$ $D = R_1 - R_2$ $D^2$
2 1 1 1
1 3 -2 4
4 2 2 4
3 4 -1 1
5 5 0 0
7 6 1 1
6 7 -1 1
N = 7     $\Sigma\text{D}^2=12$
$\text{r}_\text{s}=1-\frac{6\Sigma\text{D}^2}{\text{N}^3-\text{N}}$
$=1-\frac{6\times12}{7^3-7}=1-\frac{72}{336}=0.78$
View full question & answer
Question 174 Marks
From the following data, calculate Karl Pearson's coefficient of correlation.
X
6
2
10
4
8
Y
9
11
?
8
7
Arithmetic mean of X and Y series are 6 and 8, respectively.
Answer
Let the missing value be a $\overline{\text{Y}}=\frac{\Sigma\text{Y}}{\text{n}}=\frac{9+11+\text{a}+8+7}{5}=\frac{35+\text{a}}{5}$$\Rightarrow8=\frac{35+\text{a}}{5}\Rightarrow40=35+\text{a}\Rightarrow\text{a}=5$
Thus, the completed series is:
X 6 2 10 4 8
Y 9 11 5 8 7
Now, we find coefficient of correlation.
X $\text{x}(\text{X-}\overline{\text{X}})$ $\text{x}^2$ Y $\text{y}(\text{Y-}\overline{\text{Y}})$ $\text{y}^2$ xy
6 0 0 9 1 1 0
2 -4 16 11 3 9 -12
10 4 16 5 -3 9 -12
4 -2 4 8 0 0 0
8 2 4 7 -1 1 -2
$\Sigma\text{X}=30$   $\Sigma\text{x}^2=40$     $\Sigma\text{y}^2=20$ $\Sigma\text{xy}=-28$
Here, $\text{n}=5,\Sigma\text{x}=30,\Sigma\text{x}^2=40,\Sigma\text{y}^2=20\ \text{and }\Sigma\text{xy}=-26$$\text{r}=\frac{\Sigma\text{xy}}{\sqrt\Sigma\text{x}^2\times\Sigma\text{y}^2}=\frac{-26}{\sqrt{40\times20}}=\frac{-26}{\sqrt{800}}=\frac{-26}{28.28}=-0.9193$
It indicates that there is high degree of negative correlation between X and Y.
View full question & answer
Question 184 Marks
The ranking of ten students in two subjects A and B are as below:
A
3
5
8
4
7
10
2
1
6
9
B
6
4
9
8
1
2
3
10
5
7
What is the coefficient of rank correlation?
Answer
Calculation of Rank correlation:
$R_1$
$R_2$
$D (R_1 - R_2)$
$D^2$
3
6
-3
9
5
4
1
1
8
9
-1
1
4
8
-4
16
7
1
6
36
10
2
8
64
2
3
-1
1
1
10
-9
81
6
5
1
1
9
7
2
4


$\Sigma\text{D}^2=214$
Here, $\text{n}=10\ \text{and }\Sigma\text{D}^2=214$
$\therefore\ \text{r}_\text{k}=1-\frac{6\Sigma\text{D}^2}{\text{n}^3-\text{n}}=1-\frac{6\times214}{10^3-10}=1-\frac{1284}{990}=-0.297$
There is low degree of negative correlation between A and B subjects.
View full question & answer
Question 194 Marks
Calculate the rank correlation co-efficient between $'X'$ and $'Y'$ variables:
$X$
$10$
$20$
$35$
$14$
$18$
$21$
$16$
$Y$
$15$
$25$
$18$
$19$
$20$
$26$
$27$
Answer
$X$ $R_1$ $Y$ $R_2$ $D = R_1 - R_2$ $D^2$
10 7 15 7 0 0
20 3 25 3 0 0
35 1 18 6 -5 25
14 6 19 5 1 1
18 4 20 4 0 0
21 2 26 2 0 0
16 5 27 1 4 16
          $\Sigma\text{D}^2=42$
$\text{r}_\text{s}=1-\frac{6\Sigma\text{D}^2}{\text{N}^3-\text{N}}$
$=1-\frac{6\times42}{7^3-7}=1-\frac{252}{336}=1-0.75=0.25$
Interpretation: Very low degree correlation prevails between X and Y.
View full question & answer
Question 204 Marks
Draw a scatter diagram and indicate the nature of correlation.
X
10
20
30
40
50
60
70
80
Y
5
10
15
20
25
30
35
40
Answer

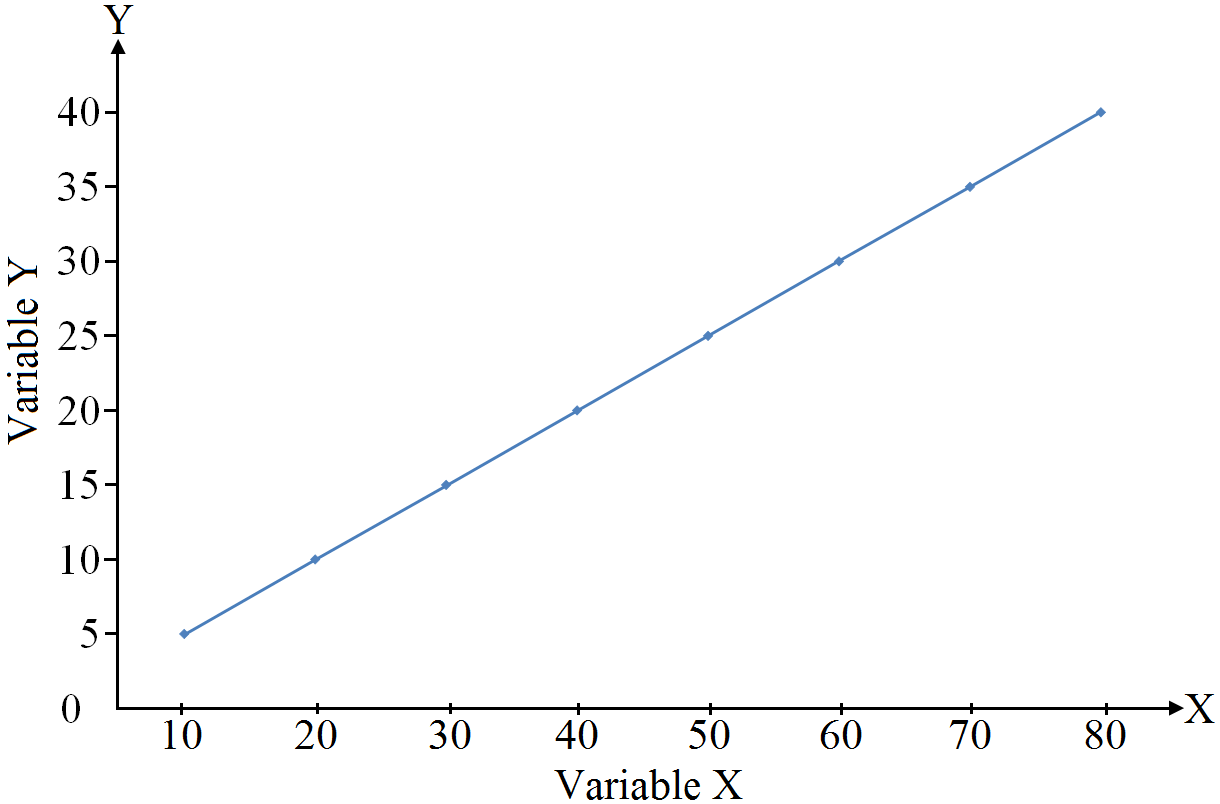
Interpretation: The diagram indicates that there is “perfect positive correlation” between the two variables X and Y.
View full question & answer
Question 214 Marks
From the data given below, calculate Karl Pearson's coefficient of correlation between density of population and death rate by step deviation method.
Region
Area (in sq km)
Population
Death
A
200
40000
480
B
150
75000
1200
C
120
72000
1080
D
80
20000
280
Answer
First of all, we shall compute density of population i.e., population per sq km and death rate per 1000.$\text{Density of Population}=\frac{\text{Population}}{\text{Area}},$
$\text{Death Rate}=\frac{\text{Number of Deaths}}{\text{Population}}\times100 $
Region Density(X) dx (X - A), A = 500 $\text{dx}'\bigg(\frac{\text{dx}}{\text{c}_1}\bigg),\text{c}_1=50$ $\text{dx}^2$ Death Rate (Y) dy (Y - A), A = 16 $\text{dy}'\bigg(\frac{\text{dx}}{\text{c}_2}\bigg),\text{c}_2=1$ $\text{dy}^2$ dx'dy'
A 200 -300 -6 36 12 -4 -4 16 24
B 500 0 0 0 16 0 0 0 0
C 600 100 2 4 15 -1 -1 1 -2
D 250 -250 -5 25 14 -2 -2 4 10
      $\Sigma\text{dx}'=-9$ $\Sigma\text{dy}^2=65$     $\Sigma\text{dy}'=-7$ $\Sigma\text{dy}^2=21$ $\Sigma\text{dx}'\text{dy}'=32$
Here, $\text{dx}'=-9,\Sigma\text{dx}'^2=65,\Sigma\text{dy}'=-7,\Sigma\text{dy}'^2=21\ \text{and}\Sigma\text{dx}'\text{dy}'=32$$\therefore\ \text{r}=\frac{\Sigma\text{dx}'\text{dy}'-\frac{\Sigma\text{dx}'\times\Sigma\text{dy}'}{\text{n}}}{\sqrt{\Sigma\text{dx}'^2-\frac{(\Sigma\text{dx}')^2}{\text{n}}\times}\sqrt{\Sigma\text{dx}'^2-\frac{(\Sigma\text{dy}')^2}{\text{n}}}} $
$\frac{32-\frac{(-9\times-7)}{4}}{\sqrt{65-\frac{(-9)^2}{4}\times\sqrt{21-\frac{(-7)^2}{4}}}}=\frac{32-15.75}{\sqrt{65-20.25\times\sqrt{21-12.25}}{}} $
$=\frac{16.25}{\sqrt{44.75}\times\sqrt{8.75}}=\frac{16.25}{6.96\times2.96}=\frac{16.25}{19.80}=0.82 $
There is high degree of positive correlation between density of population and death rate.
View full question & answer
Question 224 Marks
Find Karl Pearson’s correlation coefficient if:$\text{N}=50,\Sigma\text{x}=75,\Sigma\text{Y}=80,\Sigma\text{X}^2=130,$
$\Sigma\text{Y}^2=140\ \text{and }\Sigma\text{xy}=128.$
Answer
Using Product Moment Methode:$\text{r}=\frac{\text{N}\Sigma\text{XY}-(\Sigma\text{X})(\Sigma\text{Y})}{\sqrt{\text{N}\Sigma\text{X}^2-(\Sigma\text{X})^ 2}.\sqrt{\text{N}\Sigma\text{Y}^2-(\Sigma\text{Y})^2}}$
$=\frac{50\times128-(75)(80)}{\sqrt{50\times130-(75)^2}\sqrt{50\times140-(80)^2}} $
$=\frac{6400-6000}{\sqrt{6500-5625}\sqrt{7000-6400}}$
$=\frac{400}{\sqrt{875}\sqrt{600}}=\frac{400}{29.58\times24.49}$
$=\frac{400}{724.41}=0.55$
View full question & answer
Question 234 Marks
Calculate coefficient of correlation of the following data by the Product Moment Method:
X
8
6
4
3
4
Y
9
7
4
4
6
Answer
X X2 Y Y2 XY
8 64 9 81 72
6 36 7 49 42
4 16 4 16 16
3 9 4 16 12
4 16 6 36 24
$\Sigma\text{X}=25$ $\Sigma\text{X}^2=141$ $\Sigma\text{Y}=30$ $\Sigma\text{Y}^2=198$ $\Sigma\text{XY}=166$
Using Product Moment Methode:
$\text{r}=\frac{\text{N}\times\Sigma\text{XY}-\Sigma\text{X}\times\Sigma\text{Y}}{\sqrt{\text{N}\times\Sigma\text{X}^2-(\Sigma\text{X})^ 2}\sqrt{\text{N}\times\Sigma\text{Y}^2-(\Sigma\text{Y})^2}}$
$=\frac{5\times166-(25)(30)}{\sqrt{5\times141-(25)^2}\sqrt{5\times198-(30)^2}}$
$=\frac{80}{\sqrt{80}\sqrt{90}}$
$=\frac{80}{8.9\times9.4}=\frac{80}{83.66}=0.95$
The degree of positive correlation between the two variables is very high.
View full question & answer
Question 244 Marks
In a singing competition, two judges rank seven contestants as following:
Judge 1
5
6
7
3
1
2
6
Judge 2
6
5
2
1
3
4
7
Calculate the coefficient of rank correlation.
Answer
$R_1$ $R_2$ $D = R_1 - R_2$ $D^2$
5 6 -1 1
4 5 -1 1
7 2 5 25
3 1 2 4
1 3 -2 4
2 4 -2 4
6 7 -1 1
      $\Sigma\text{D}^2=40$
$\text{r}_\text{s}=1-\frac{6\Sigma\text{D}^2}{\text{N}^3-\text{N}}$
$=1-\frac{6\times40}{7^3-7}=1-\frac{240}{336-7}=1-0.71=0.29$
View full question & answer
Question 254 Marks
Calculate the coefficient of rank correlation from the following data.
X
75
88
95
70
60
80
81
50
Y
120
134
150
115
110
140
142
100
Answer
$X$
$R_1$
$Y$
$R_2$
$D = R_1 - R_2$
$D^2$
75
5
120
5
0
0
88
2
134
4
-2
4
95
1
150
1
0
0
70
6
115
6
0
0
60
7
110
7
0
0
80
4
140
3
1
1
81
3
142
2
1
1
50
8
100
8
0
0


$\Sigma\text{D}^2=6$
Here, $\text{n}=8\ \text{and }\Sigma\text{D}^2=6$
$\therefore\ \text{r}_\text{k}=1-\frac{6\Sigma\text{D}^2}{\text{n}^3-\text{n}}=1-\frac{6\times6}{8^3-8}=1-\frac{36}{504}=1-0.071=+0.929$
It indicates that there is high degree of positive correlation between X and Y variables.
View full question & answer
Question 264 Marks
Ten competitors in a beauty contest are ranked by two judges in the following order:
First Judge
3
5
8
4
7
10
2
1
6
9
Second Judge
6
4
9
8
1
2
3
10
5
7
Calculate the co-efficient of correlation.
Answer
First Jdge $(R_1)$ Second Judge $(R_2)$ $D = R_1 - R_2$ $D_2$
3 6 -3 9
5 4 1 1
8 9 -1 1
4 8 -4 16
7 1 6 36
10 2 8 64
2 3 -1 1
1 10 -9 81
6 5 1 1
9 7 2 4
      $\Sigma\text{D}^2=214$
$\text{r}_\text{s}=1-\frac{6\Sigma\text{D}^2}{\text{N}^3-\text{N}}$
$=1-\frac{6(214)}{10^3-10}=1-\frac{1284}{990}=1-0.29=0.29$
Interpretation: There is a low degree of negative rank correlation.
View full question & answer
Question 274 Marks
Calculate Rank coefficient of correlation from following data:
X $12$ $10$ $8$ $10$ $11$ $9$ $15$
Y $26$ $20$ $24$ $20$ $18$ $22$ $20$
Answer
$X$ $Y$ $R_1$ $R_2$ $D= R_1 - R_2$ $D^2$
$12$ $26$ $2$ $1$ $1.0$ $25.00$
$10$ $20$ $4.5$ $5$ $-0.5$ $0.25$
$8$ $24$ $7$ $2$ $5.0$ $25.00$
$10$ $20$ $4.5$ $5$ $-0.5$ $0.25$
$11$ $18$ $3$ $7$ $-4.0$ $16.00$
$9$ $22$ $6$ $3$ $3.0$ $9.00$
$15$ $20$ $1$ $5$ $-4.0$ $16.00$
  $\Sigma\text{D}^2=91.50$
$\text{r}_\text{s}=1-\frac{6\Big[\Sigma\text{D}^2+\frac1{12}(\text{m}^3-\text{m})+\frac1{12}(\text{m}^3-\text{m})+\dots\Big]} {\text{n}^3-\text{n}}$
$=1-\frac{6\Big[91.50+\frac1{12}(2^3-2)+\frac1{12}(3^3-3)}{7^3-7}$
$=1-\frac{6\Big[91.50+\frac1{12}\times(8-2)+\frac1{12}(27-3)\Big]}{343-7}$
$=1-\frac{549+0.5+2}{336}=1-\frac{551.5}{3336}$
$=1-1.64=(-)0.64$
View full question & answer
Question 284 Marks
What do you find in following cases correlation/ causation?
  1. When investigating the cause of crime in New York City in the 80s, when they were trying to clean up the city, an academic found a strong correlation between the amount of serious crime committed and the amount of ice cream sold by street vendors!
  2. The size of your palm is negatively correlated with how long you will live (really!). In fact, women tend to have smaller palms and live longer.
  3. I heard of a study a few years ago that found the amount of soda a person drinks is positively correlated to the likelihood of obesity.
Answer
As:
  1. Indicate correlation and if rightly said, is spurious correlation however
  2. May be a causation.
View full question & answer
Question 294 Marks
Calculate the co-efficient of correlation of the following data by the Spearman's rank co-relation method.
X 19 24 12 23 19 16
Y 9 22 20 14 22 18
Answer
$X$
$Y$
$R_1$
$R_2$
$D= R_1 - R_2$
$D^2$
19
9
3.5
6
-2.5
6.25
24
22
1
1.5
-0.5
0.25
12
20
6
3
3.0
9.00
23
14
2
5
-3.0
9.00
19
22
3.5
1.5
2.0
4.00
16
18
5
4
1.0
1.00


$\Sigma\text{D}^2=29.50$
$\text{r}_\text{k}=1-\frac{6\bigg[\Sigma\text{D}^2+\frac{1}{12}\text{(m}^3-\text{m)}+\frac{1}{12}\text{(m}^3-\text{m}+\dots\bigg]}{\text{n}^3-\text{n}}$ where $m_1, m_2$ are the number of repetitoin of ranks and $\frac{\text{m}_1^3-\text{m}_2}{12}\dots$ their corresponding correction factors.
$1-\frac{6\bigg[29.50+\frac{1}{12}(2^3-2)+\frac{1}{12}({2^3-2})\bigg]}{6^3-6}$
$=1-\frac{6(29.50+0.5+0.5)}{210}=1-\frac{6\times30.5}{210}$
$=1-\frac{183}{210}=1-0.87=0.13$
View full question & answer
Question 304 Marks
Why does rank correlation coefficient differ from Pearsonian correlation coefficient?
Answer
Rank coefficient differs from pearsonian correlation coefficient because in rank coefficient, specific ranks are assigned to the data which leads to loss of information and all the information regarding the data is not utilised. Only if the data in the rank coefficient method is ranked precisely, it leads to similar values as the pearsonian coefficient. The value of rank coefficient also differs due to the first differences of the value of items in the series arranged are almost never constant. Generally, both the methods result in same value of ‘r’, but pearsonian coefficient is more widely used than rank coefficient as it utilizes information from the whole series of frequency distribution.
View full question & answer
Question 314 Marks
When is rank correlation more precise than simple correlation coefficient?
Answer
Rank correlation is more precise than simple correlation coefficient in situations when it is required quantify qualities. Ranking is a better alternative for quantification of qualities, which can’t be done in simple correlation. It is also useful when correlation coefficient between two variables with extreme values is quite different from the coefficient without the extreme values.
For example: In a beauty contest judges may have to prepare a list of participants in order of their beauty. There is no procedure or numerical system which judges beauty, so in order to prepare a list judges rank the participants based on their features. In this manner rank correlation can be used which gives more precise value than the simple correlation.
View full question & answer
Question 324 Marks
Calculate the co-efficient of correlation for the following data by the actual mean method.
X
65
66
67
68
69
70
71
Y
67
68
66
69
72
72
69
Answer
X Y $\text{X}-\overline{\text{X}}$ $(\text{X}-\overline{\text{X}})^2$ $\text{Y}-\overline{\text{Y}}$ $(\text{Y}-\overline{\text{Y}})^2$ $(\text{X}-\overline{\text{X}})(\text{Y}-\overline{\text{Y}})$
65 67 -3 9 -2 4 6
66 68 -2 4 -1 1 2
67 66 -1 1 -3 9 3
68 69 0 0 0 0 0
69 72 1 1 3 9 3
70 72 2 4 3 9 6
71 72 2 4 3 9 6
$\Sigma\text{X}=476$ $\Sigma\text{Y}=483$   $\Sigma\text{(X}-\overline{\text{X}})^2=28$   $\Sigma\text{(Y}-\overline{\text{Y}})^2=32$ $\Sigma\text{(X}-\overline{\text{X}})\text{(Y}-\overline{\text{Y}})=20$
$\overline{\text{X}}=\frac{\Sigma\text{X}}{\text{N}}=\frac{476}{7}=68$ $\overline{\text{Y}}=\frac{\Sigma\text{Y}}{\text{N}}=\frac{483}{7}=69$
$\text{r}=\frac{\Sigma\text{(X}-\overline{\text{X}})(\text{Y}-\overline{\text{Y}})}{\sqrt{\Sigma\text{(X}-\overline{\text{X}}) ^2}\sqrt{\Sigma(\text{Y}-\overline{\text{Y}})^2}}$
$\frac{20}{\sqrt{28}.\sqrt{32}}=\frac{20}{29.88}=0.66$
View full question & answer
Question 334 Marks
We are given the percentage of marks scored by six students in two subjects. Calculate coefficient of rank correlation:
Students
Mathmatics
Economics
A
85
60
B
60
48
C
55
49
D
65
50
E
75
55
F
90
62
Answer
Marks Mathmatics $(X)$
$R_1$
Marks Economics
$R_2$
$D = R_1 - R_2$
$D2$
85
2
60
2
0
0
60
5
48
6
-1
1
55
6
49
5
1
1
65
4
50
4
0
0
75
3
55
3
0
0
90
1
62
1
0
0
N = 6


$\Sigma\text{D}^2=2$
$\text{r}_\text{s}=1-\frac{6\Sigma\text{D}^2}{\text{N}^3-\text{N}}$
$=1-\frac{6\times2}{6^3-6}=1-\frac{12}{210}=1-0.5=0.5$
View full question & answer
4 Marks Question - Economics STD 11 Commerce Questions - Vidyadip