Question 15 Marks
Explain the price determination process of market along with a diagram.
Answer
Process of price determination:
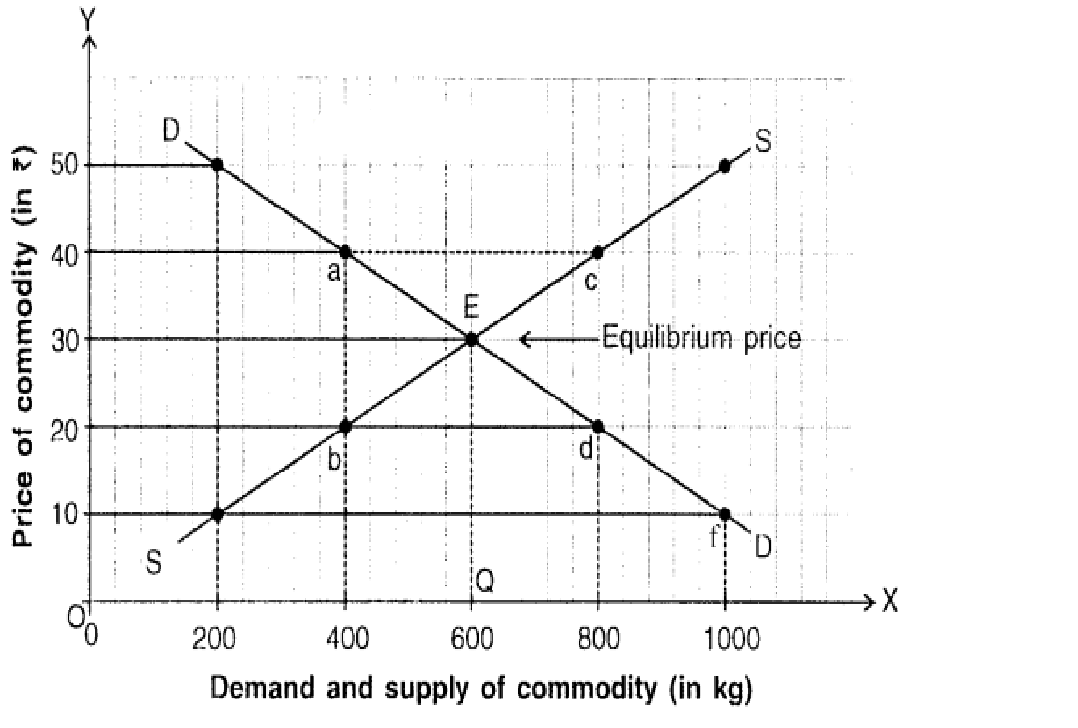
Diagram of price determination Case $1:$
If the industry raises its price to $₹ 40$ then ignoring the demand and supply schedules, the total demand contracts to $400$ units from $600$ units while the supply expands to $800$ units. Since demand is lesser than supply as shown by the distance between points $‘a’$ and $‘c’,$ the market price will tend to fall back to $₹ 30.$ This is called the equilibrating process of the market.
Case $2:$
Suppose if price is reduced by the industry to $₹ 20$ by ignoring the demand and supply schedules, the total demand expands to $800$ units while supply contracts to $400$ units. Since demand is greater than supply as shown by the distance between points $‘d’$ and $‘b’,$ the market price will tend to rise back to $₹ 30.$ This again is the invisible process of the market.
View full question & answer→Process of price determination:
- A consumer thinks that prices are decided by the producer or seller. But in reality individual producers or sellers do not decide the prices.
- Prices are determined by the interaction of market demand and supply.
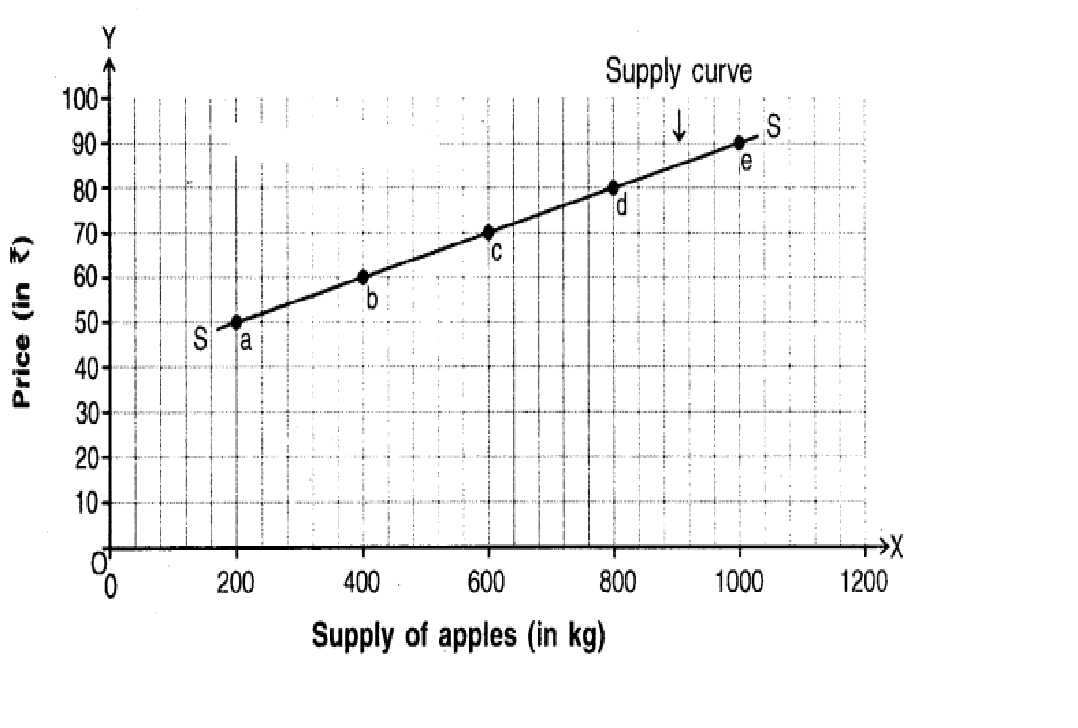
- As per demand schedule, as the price rises the demand decreases where as in supply schedule, as price rises the supply increases. Thus, the demand curve slopes downward from left to right where as the supply curve slopes upward from left to right.
- Since supply schedule and demand schedule move in opposite directions, equilibrium is attained only at a point where these two curves intersect each other. This point of intersection is called point of price equilibrium. Such an equilibrium price for goods exists in the market.
- Individual sellers take this equilibrium price as a signal to determine prices of their individual products in the market.
- In case of perfect competition firms take this price as signal whereas in case of monopoly and oligopoly, markets take this price as a signal. Even a monopolist has to take a price signal from the total demand and total supply.
- The schedule given below shows demand and supply of a commodity at various prices. The diagram shows the demand and supply curve and their interaction.
- According to Marshall, the market demand and market supply are called the invisible hands of market and the entire process is invisible. The two curves i.e. the demand curve and supply form a cross as shown in the figure.
- In the figure, the demand curve $DD$ and the supply curve SS move in the opposite directions. They intersect at point $‘E’$ which is called the equilibrium point.
- At equilibrium point the equilibrium price is $₹ 30$ which can be determined by plotting $EQ. $ At this price, quantity demanded and supplied i.e. $OQ$ is $600$ units. This is called the equilibrium quantity.
| Price of a commodity (in ₹) | Demand of commodity (in kg) | Supply of commodity (in kg) |
| $10$ | $1000$ | $200$ |
| $20$ | $800$ | $400$ |
| $30$ | $600$ | $600$ |
| $40$ | $400$ | $800$ |
| $50$ | $200$ | $1000$ |
Diagram of price determination Case $1:$
If the industry raises its price to $₹ 40$ then ignoring the demand and supply schedules, the total demand contracts to $400$ units from $600$ units while the supply expands to $800$ units. Since demand is lesser than supply as shown by the distance between points $‘a’$ and $‘c’,$ the market price will tend to fall back to $₹ 30.$ This is called the equilibrating process of the market.
Case $2:$
Suppose if price is reduced by the industry to $₹ 20$ by ignoring the demand and supply schedules, the total demand expands to $800$ units while supply contracts to $400$ units. Since demand is greater than supply as shown by the distance between points $‘d’$ and $‘b’,$ the market price will tend to rise back to $₹ 30.$ This again is the invisible process of the market.